Tohoku Earthquake
Status: Closed
Update 3 | Summary
Posting Date: March 22, 2011, 7:15:00 AM
The AIR earthquake team continues to analyze available ground motion data and is developing detailed footprints of the tsunami using satellite imagery and other sources. A discussion of preliminary findings is provided below, after a brief overview of events in Japan. AIR's current plan is to refine the shake and fire-following loss estimates posted on March 12 and to issue an updated loss estimate for combined shake, fire-following and tsunami losses. Notification will be sent when the new estimate is available.
Update on Reported Damage as of March 21
Ten days after the earthquake—which was followed within 15 minutes by a powerful tsunami that rose as high as ten meters in places—attention outside of Japan has focused on efforts to avert a nuclear reactor meltdown at the six-reactor Fukushima power plant. With explosions, fires, and the periodic uncontrolled release of radiation plaguing repair efforts, the Japanese government declared a 20-kilometer danger zone around the plant and evacuated more than 175,000 people from the area. On Sunday, March 20, modest progress in stabilizing the reactors was made. After connecting a mile-long electrical transmission line, electricity was restored to two of the reactors. Even so, the Japanese government also reported on Sunday that radioactive contamination had been detected in agricultural produce and livestock in several nearby prefectures. Today, March 21, gray smoke unexpectedly rose from two reactors and workers were once again recalled from the plant, stalling repair work and placing the fate of the reactors in uncertainty once again. However, while the eventual impact of the damaged reactors remains unknown, the radiation release so far monitored has not been thought to be a major threat to health and well-being. The Tohoku earthquake, for which both the Japan Meteorology Agency and the United States Geological Survey (USGS) have now converged on an estimated magnitude of 9.0, was the fourth largest earthquake in the world since 1900 and the largest in Japan’s lengthy historical catalog. The problems at the Fukushima-Daiichi power plant aside, the impact of the double hammer blows of the earthquake and tsunami have been staggering. Japan’s Fire and Disaster Management Agency (FDMA), which reports only cases that have been verified and whose numbers are therefore still conservative, has reported 8,078 deaths as of Monday, and 10,507 people missing. The agency listed 2,949 people as having been injured, 483 with major injuries. The FDMA has also recorded a total of 325 fires that have broken out following the earthquake, damage to 48 bridges and the occurrence of 95 landslides. Counts of building damage from the FDMA as of Monday, March 21, are provided in the table below. They are expected to continue to rise.Table 1. Estimates of Human Impacts and Building Damage as Reported by Japan’s FDMA as of March 21, 2011 (Source: FDMA).
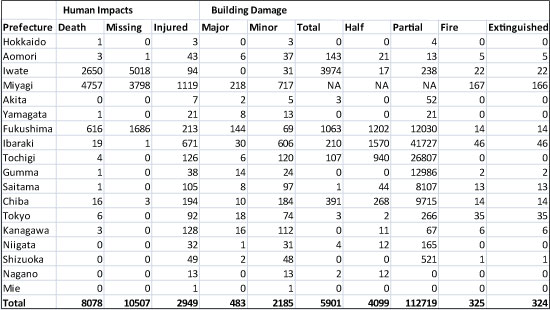
Information from other sources indicate that by Monday afternoon more than 450,000 people have been evacuated from affected areas and as many as 350,000 are living in shelters around the country. Also, according to the Japan Health Ministry, an estimated 1.04 million households in 11 prefectures were without running water as of Saturday, while almost 245,000 households in the north of Honshu island remained without electricity as of Sunday evening, according to the Tohuku Electric Power Company. The Japan Defense Force has 80,000 troops helping in rescue, relocation, and emergency services efforts.
Analysis of Seismic Source Characteristics
Reconstructing a full understanding of the Tohoku event is challenging, both for instrumental reasons—the widespread loss of power and infrastructure—and because of the inherent complexity of the event which, for this region, is unprecedented in its magnitude and impact. The challenges are illustrated, in part, by the different estimates of the characteristics of the rupture at the source and in the distribution of seismic slip that occurred along the rupture plane. The length, width, and slip distribution of the earthquake have been estimated from seismic waveform data immediately after the event by the USGS, later by Professor Yuji Yagi of Japan’s Tsukuba University, and also by other institutions and individual researchers. The early distribution produced by the USGS appears immediately below along with a map of the general location of the rupture plane as estimated by the USGS one day after the event. The red star indicates the location of the epicenter on the rupture plane. Note that the rupture plane as illustrated in the left hand panel of the figure below should be rotated clockwise such that the reference points A and B are aligned with the rectangle in the right hand panel.
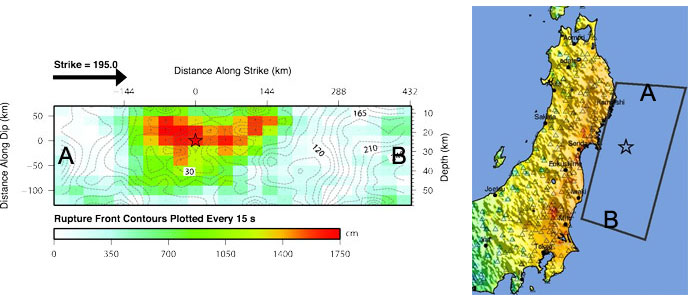
Figure 1. Slip distribution as estimated by the USGS one day after the earthquake. The rupture plane as illustrated in the left hand panel of the figure below should be rotated clockwise such that the reference points A and B are aligned with the rectangle in the right hand panel. (Source: USGS). Over the last week, several research groups have used GPS data to estimate the slip distribution of the Tohoku earthquake. Most groups have found from both seismic wave data and GPS data that the maximum slip within the rupture plane is about 20-25 meters, but that its distribution is highly nonuniform. The challenge is that the solutions produced by the different reporting groups can differ significantly. For example, the maximum slip obtained from USGS based on seismic data is located in the epicentral area, whereas the result from Prof. Yagi—also based on seismic waveform data—is located 180 kilometers southeast of the epicenter. Prof. Yagi’s result appears below. The star again is the location of the epicenter. In this result, the maximum slip is 23.2 meters, about 180 km from the epicenter.
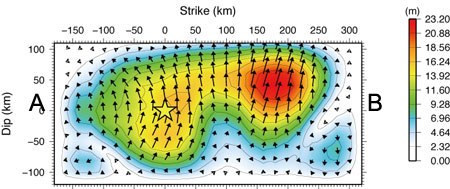
Figure 2. Slip distribution as estimated by Professor Yagi at Japan’s Tsukuba University. Note that the rupture plane should be rotated clockwise such that the reference points A and B are aligned with the rectangle in the right hand panel of Figure 1. (Source: Tsukuba University). The USGS result suggests that the main rupture could be as long as 650 km—with the main energy (the most coseismic slip) distributed within about 350-400 km. Professor Yagi’s solution suggests that the rupture length and width are about 450 and 200 km respectively, with the main slip (energy) distributed in two areas, one near the epicenter and the other about 180 km southeast of the epicenter. Preliminary GPS data suggests that most of the Tohoku rupture have occurred above the depth of 45 km, most likely in a range between 10 to 45 km, indicating a rupture width of 135 km. Also, GPS data suggests more than four meters of eastward movement and 0.4 to 0.7 meters of subsidence of the eastern coast of Honshu (in Miyagi Prefecture). More than one meter of post-seismic slip has also been observed throughout the entire rupture area two weeks after the main shock. AIR’s current analysis is taking all of the above information—and more—into account to construct a coherent picture of the seismic energy released by this event and of the resulting ground motion and damage.
Analysis of Ground Motion
One interesting—and possibly significant—feature is that, for an event of this magnitude, the low-frequency (long-period) content of the ground motion was unusually low. During an earthquake, the fault rupture plane radiates seismic waves of many different frequency bands. Many factors can affect the intensity and frequency of these seismic waves: the inherent structural characteristics (shear strength, for example) of rock that make up the tectonic plates; slip velocity, or how quickly a rupture front propagates through a rupture area; and the specific characteristics of the “stress drop,” or the amount by which stress along the fault changes as a result of the earthquake. In general, small and intermediate magnitude earthquakes tend to radiate seismic energy that is relatively rich in high frequency waves. As the magnitude of an earthquake increases, it is expected that the share of long-period seismic waves will increase. However, various complexities within the rupture plane could reduce the coherence of the rupture front, thus adversely affecting the intensity of the long-period waves. A better understanding of the causes behind the ground motion that was actually observed in the Tohoku event will develop over the course of the months to come. The chart below was published by Professor Yuki Sakai at Japan’s Tsukuba University. It shows response spectra for the Tohoku earthquake as measured at various sites in Japan, as well as the response spectra from the 1995 Kobe earthquake, which is represented by the red line. The vertical axis shows spectral acceleration, while the horizontal axis is building period. The peak between 1.0 and 1.5 seconds apparent in the Kobe earthquake ground motion is absent from the ground motions from the Tohoku earthquake—and it is within this band that damage to taller buildings is most significant, all else held constant. Thus the implication is that damage to these buildings may be lower than initially expected for the Tohoku event. On the other hand, the significant high frequency content (between 0 and 0.5 seconds) for this event would suggest considerable damage to low-rise structures and to contents. It is also important to point out that total damage can be significant, as the damage footprint from this event is very large.
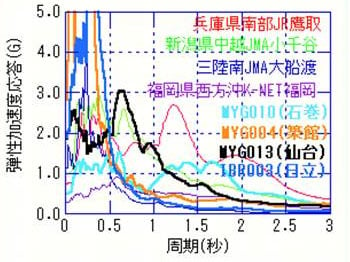
Figure 3. Response spectra from the Tohoku earthquake (various colors) and from the 1995 Kobe earthquake (red line) published by Prof. Sakai, Tsukuba University. (Source: Tsukuba University).
Reconstructing the Tsunami Footprint
In addition to developing a better understanding about ground motion and its likely effect on insured losses from the Tohoku earthquake, AIR is also generating a footprint of the tsunami that followed the earthquake. The process involves multiple steps. Satellite images and maps of affected regions in the most impacted prefectures— Fukushima, Ibaraki, Miyiagi, Iwate, Amori, and Hokkadio—were collected from several government agencies. Using elevation data from the USGS and wave height data from the Japan Meteorological Agency, three inundation regions were generated based on topography and observed wave height, and raster cells below a certain elevation were selected. After going through a modeling process, the final footprint was then compared to more than 150 known flooded regions that had been collected from the satellite imagery. Thus far, the modeled footprint compares very well with the known flooded regions throughout the entire impacted area. Further validation was undertaken using the Princeton Ocean Model (POM)— a numerical grid point model that is used for many oceanographic applications worldwide. The model has been successfully used to simulate the main features of the tsunami from the Tohoku earthquake. POM output is providing necessary information for areas where higher resolution data from other sources is unavailable. Although the tsunami footprint is still being finalized, the maps below illustrate the output. These show the modeled inland penetration in the Ishinomaki area (top) and in Soma (bottom).
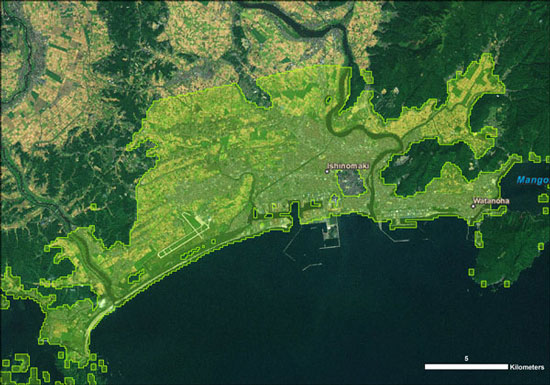
Figure 4. AIR’s modeled inland penetration of the tsunami at Ishinomaki, north of Sendai. (Source: AIR).
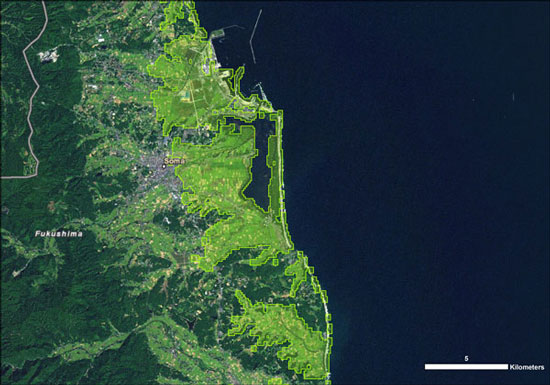
Figure 5. AIR’s modeled inland penetration of the tsunami at Soma, south of Sendai. (Source: AIR). The AIR earthquake team is continuing to analyze the available data on ground motions and tsunami extent. NewsALERT subscribers will be notified when an updated loss estimate for combined shake, fire-following and tsunami losses is available.