M6.0 Napa California Earthquake
Status: Closed
| Type of posting | Posting date(EST): | Summary | Downloads |
|---|---|---|---|
| Update 1 | 8/29/2014 11:59:00 AM |
|
|
| First Posting | 8/25/2014 6:00:00 AM |
|
Update 1 | Summary
Posting Date: August 29, 2014, 11:59:00 AM
Two days after the magnitude 6.0 earthquake in Northern California, AIR engineers Ivan Gomez and Aaron Michel surveyed the damage. The observations and photos provide insight into the kinds of damage patterns caused by this event
On Sunday, August 24, a magnitude 6.0 earthquake struck Northern California at 3:20 a.m. local time. The Napa and Solano county regions of Northern California experienced significant ground shaking and structural damage. Measured peak ground acceleration in the region of the epicenter exceeded 0.4g and the station nearest to downtown Napa, CA, recorded 0.65g (Table 1).
Table 1: Acceleration measurements at 4 stations nearest to the epicenter
Station Name | Distance to Source (km) | Peak PGA (g) | Peak Sa @ 0.3s (g) | Peak Sa @ 1.0s (g) |
CA:Napa;FS 3 | 2.6 | 0.45 | 0.61 | 1.02 |
Huichica Creek | 3.9 | 0.41 | 1.07 | 0.36 |
Napa - Napa College | 4.0 | 0.36 | 0.82 | 0.53 |
Main St Napa | 3.9 | 0.65 | 1.20 | 0.42 |
Vallejo | 11.4 | 0.20 | 0.52 | 0.14 |
Perceived shaking in the Napa and American Canyon regions ranged from severe (VIII) on the Modified Mercalli Intensity Scale (MMI) to violent (MMI IX) according to the USGS. Approximately 250 injuries, mostly minor, and no fatalities were reported.
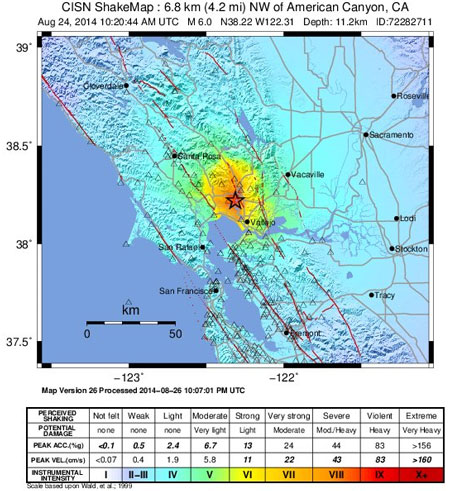
Figure 1: ShakeMap of M 6.0 South Napa earthquake. (Source: USGS)
In general, the observed ground motions were below design code levels extant in California today. Not surprisingly, therefore, the most significant damage that the AIR damage survey team observed was to older unreinforced masonry (URM) buildings—specifically to their walls, chimneys, parapets, and foundations. Structural damage to newer construction was generally limited. Most of the damage and losses will be driven by commercial properties and contents.
Notably, damage in American Canyon—the town closest to the epicenter—was negligible. On the other hand, the historic downtown of Napa, which is 6 miles north-northeast of the epicenter, did experience some significant damage. This may be related to the direction of the fault rupture. A map of the slip distribution developed by Professor Doug Dreger, Ph.D., of the Berkeley Seismological Laboratory indicates that the rupture propagated to the northwest, toward Napa and away from American Canyon. Moreover, the soft sediments that make this region ideal for vintners also amplify ground motion.
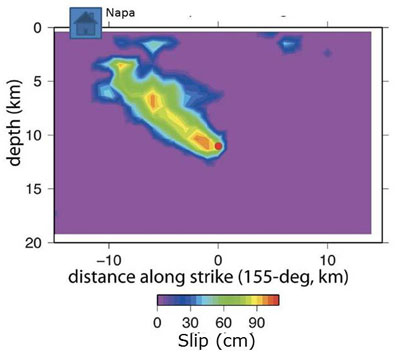
Figure 2. Slip distribution for the M6.0 American Canyon earthquake. The red dot in the center indicates the location of the hypocenter. (Source: Berkeley Seismological Laboratory)
One obvious question in the aftermath of this event is how seismic stresses have been redistributed. Analysis will likely take months. However, as a sponsor and founding member of the Global Earthquake Model, AIR received a very preliminary calculation of the Coulomb stress change from Dr. Ross Stein of the USGS that indicates an increase in stress on both the Rodgers Creek-Hayward fault to the west of the West Napa fault, and on the Green Valley fault to the east. Whether the West Napa fault is, in fact, the causative fault is still under investigation.
Take-Up Rates
In terms of estimating industry insured losses for this event, there is much that remains uncertain. Perhaps the biggest uncertainty is with respect to commercial take-up rates, including business interruption. The earthquake occurred during the height of the wine country’s tourist season and many wineries remain closed. In addition, estimating contents damage is particularly challenging; some bottles of wine that were destroyed in Napa had replacement values in the tens of thousands.
The percentage of California homeowners who have an earthquake policy is about 12%, higher in fault zones and lower outside of them (see Figure 3). In mid-2012, for the first time California earthquake policyholders could choose to obtain coverage just for the structure, or just the structure and its contents, or just the structure and living expenses through the California Earthquake Authority, the privately funded, publicly managed, not-for-profit that bears a little more than two thirds of California’s insured residential property risk.
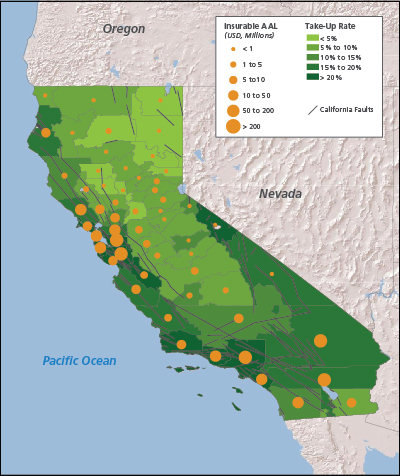
Figure 3. Residential take-up rate and insurable average annual loss by county. (Source: AIR)
AIR Damage Survey Findings
Two days after the event, AIR engineers Ivan Gomez and Aaron Michel surveyed the damage. The commentary and photos that follow provide insight into the kinds of damage patterns caused by this event.
Damage from the earthquake was primarily localized to the cities of Napa and Vallejo. As of August 27, there were 120 red tagged and 500 yellow tagged buildings, and 208 reported injuries in the city of Napa. In the city of Vallejo, there were 10 red tagged and 34 yellow tagged buildings, and 49 reported injuries. The city of American Canyon reported no red or yellow tagged buildings. The City of Napa estimates USD 300 million in private property damage. Vallejo City officials estimate USD 5 million in damage. Table 2 provides a brief summary of the damage based on published reports and the damage survey.
Table 2: Damage summary of the 2014 M6.0 American Canyon Earthquake (as of 8/27/14)
Location | USGS Shakemap,MMI | Reported/Observed Damage |
Vallejo / Mare Island | VI | 10 red tagged buildings |
American Canyon | VII | No red or yellow tagged buildings |
Napa | VIII | 120 red tagged buildings |
Epicentral Region | Slight to no damage to rural houses |
Maps of damaged structures and water mains in the cities of Napa and Vallejo are available on the following two websites:
- http://cityofnapa.maps.arcgis.com/apps/Viewer/index.html?appid=82a341fa5c5b4f4bb32381b82541e7fc
- https://mapsengine.google.com/map/edit?mid=zoum54Kk969U.kTP_lV9mb52o
Vallejo
The buildings damaged in Vallejo appeared to be primarily older structures with unreinforced masonry (URM) structural systems or façades. In general, damage was limited to masonry parapets, chimneys, plate glass windows, and shear cracking at reentrant corners of windows and doors. The downtown post office reportedly experienced damage to interior structural roof elements. Because the structure was red tagged, AIR could not observe the damage. Another badly damaged URM commercial building in downtown Vallejo experienced an internal wall collapse and partial collapse of a raised rooftop structural element, which were not visible from the outside. Observed structural damage in Vallejo is documented in in Figure 4 and Figure 5.
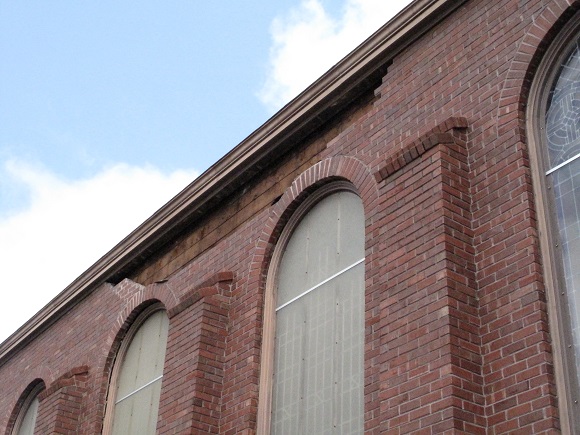
Figure 4: Damaged church with URM walls in Vallejo. Yellow tagged.
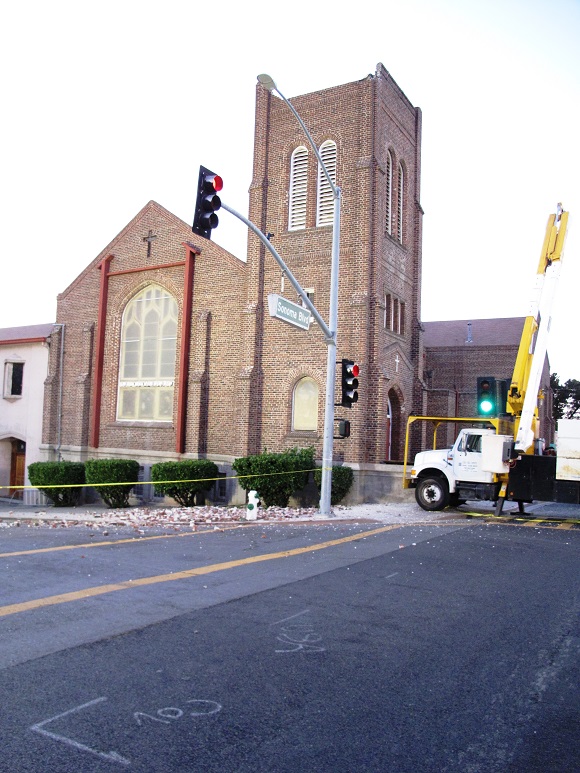
Figure 5: URM parapet failure at a church in Vallejo. Red tagged.
The Mare Island naval complex on the west side of Vallejo housed several older URM buildings that experienced substantial damage. Many of the structures in this region are either abandoned or not currently in use, making it difficult to determine precisely what damage was caused by the earthquake. Some nonstructural damage was observed at Tuoro University, which is also on Mare Island.
Napa
The building damage in Napa was primarily concentrated in the downtown region near the Napa River and represented the most severe observed structural and nonstructural damage. Typical damage included masonry parapet failure, masonry chimney failure, plate glass window damage, masonry spalling (chipping, fragmenting, or flaking), shear cracking in stucco façades, stepped cracking in masonry walls, and shear cracking at reentrant corners. While many of the damaged buildings were of older URM construction, several recently retrofitted and newly built structures were also badly damaged or partially collapsed. Wood-frame residential structures were observed to have performed well, with little damage to the primary or sub-structures. A significant percentage of chimneys appeared to have collapsed or been damaged. Heavy shaking and fire damage was reported in several mobile home parks, but these were not investigated by the AIR damage survey team.
Contents damage was reported to be significant in the region, which is famous for its wine industry. Plate glass windows, hanging ceilings, and merchandise were commonly damaged (Figure 6). One local shop (an olive oil and vinegar retailer) reportedly lost 80% of its inventory in the event, although structural damage in the building was minor. Many wine shops and wineries also reported substantial losses from inventory damage.
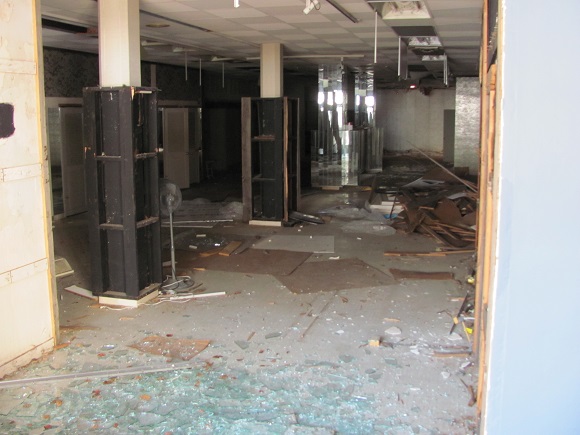
Figure 6: Interior damage and broken windows in an unoccupied building in downtown Napa.
The AIR damage survey team observed that a recently built (circa 2008) structure (commercial bank, apparent steel frame and cold form steel construction) suffered significant damage from a southwest-facing wall that detached from the primary structural system and bowed out over the adjacent structure. Another nearby newly constructed building, a commercial hotel, exhibited significant shear cracking and façade spalling throughout (Figure 7). A local AT&T facility suffered damage from a removable wall panel collapsed due to shear anchor failure (Figure 8). Despite some damage to the equipment and structure, the facility did not experience any downtime. This facility is responsible for handling and routing all 911 call traffic for the city of Napa.
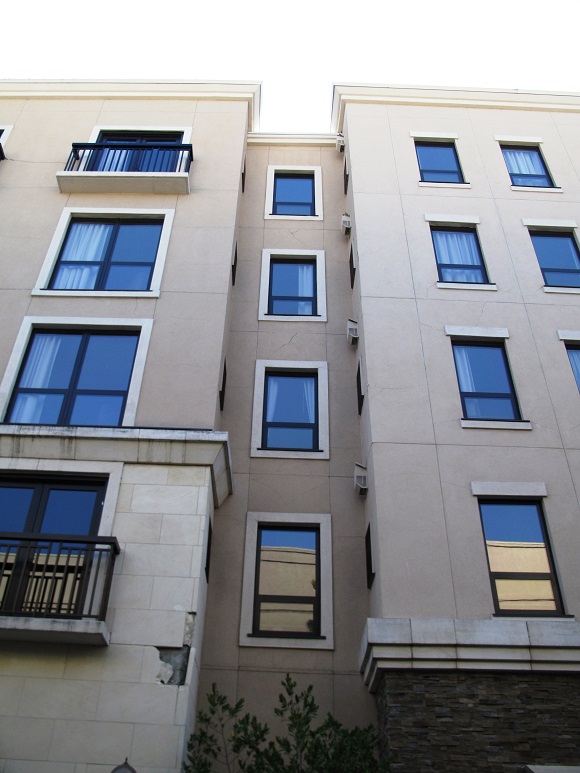
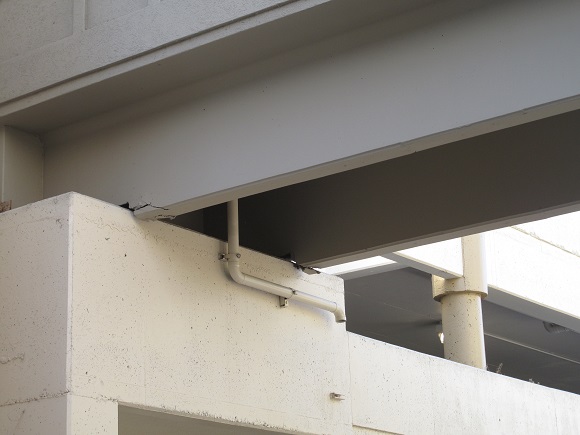
Figure 7: Damaged newly built commercial hotel building in Napa. Yellow tagged.
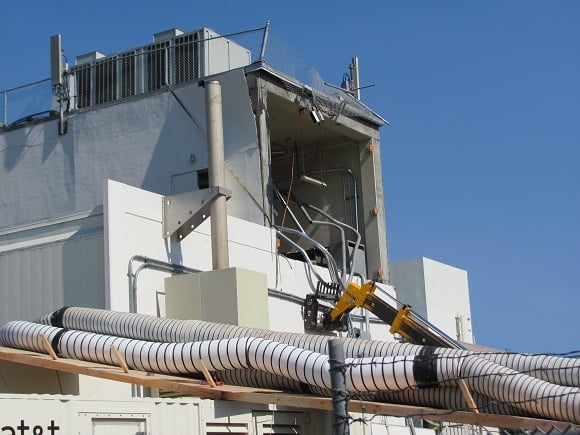
Figure 8: Removable wall panel at the AT&T communications facility failed at embedded shear anchors. Discussions with the onsite engineer revealed that this location routes all 911 calls in the region and that, despite the damage, the facility did not experience any downtime.
Two recently retrofitted structures that attracted significant media attention experienced partial collapses due to exterior URM wall failure. The primary structural systems of the buildings, one wood-framed (Figure 9) and the other steel framed (Figure 10), appear to have remained intact. Insufficient anchorage between the primary structural system and the heavy exterior masonry walls is suspected to have led to this damage.
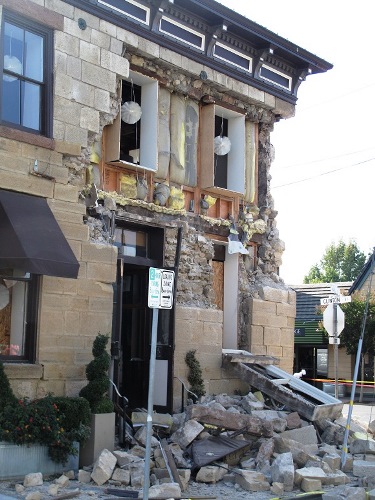
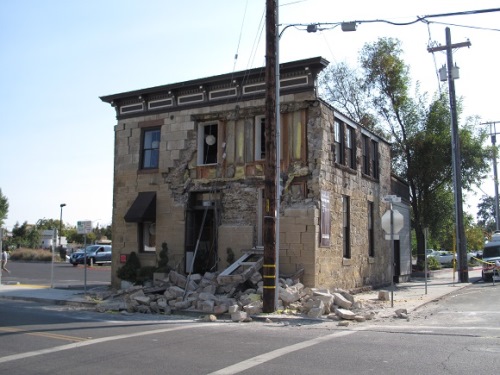
Figure 9: Two-story URM structure renovated with interior wooden framing that experienced façade failure.
Red tagged.
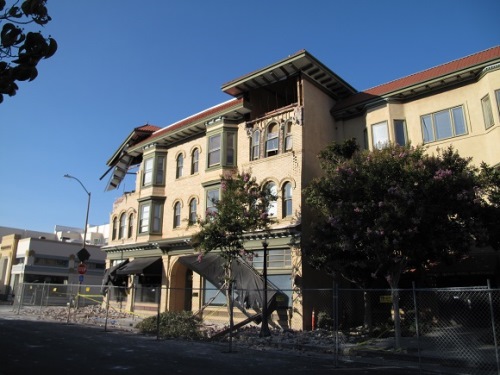
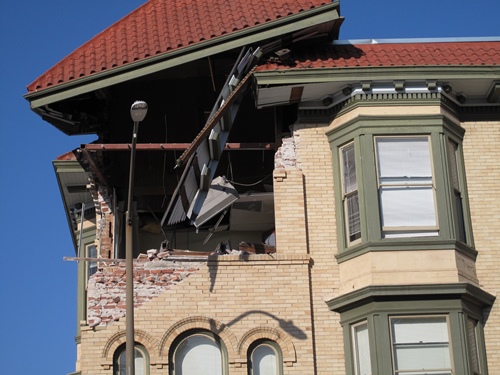
Figure 10: Three-story downtown URM structure renovated with interior steel framing that experienced façade failure and partial collapse. This and all adjacent structures red tagged.
Other buildings throughout Napa experienced varying levels of damage. As expected, many URM buildings were heavily damaged, while many wood-frame residential structures experienced, at most, a chimney failure. The green, yellow, and red tagging system was used to evaluate the most heavily damaged buildings. Commercial and government buildings seemed to be given inspection priority. Speaking with several local citizens revealed that there are many residential structures that have some level of damage but had not yet been inspected. Examples of other damage observations are documented in the following figures.
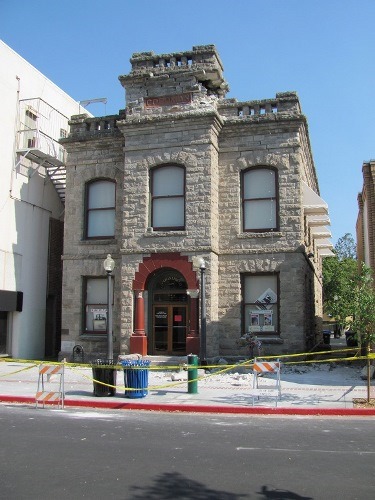
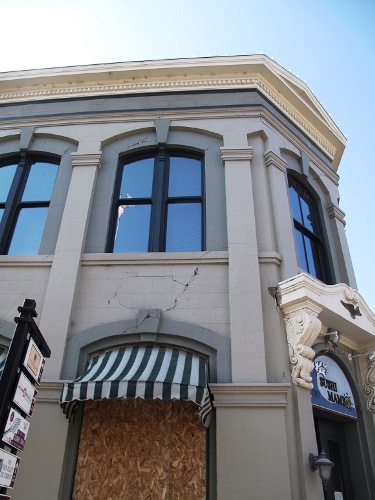
Figure 11: (top) Upper unreinforced parapet failure, other shear step-cracks noted throughout base.
(bottom) Diagonal shear cracking through masonry walls and masonry spalling at corners. Horizontal cracks across columns. Both structures red tagged.
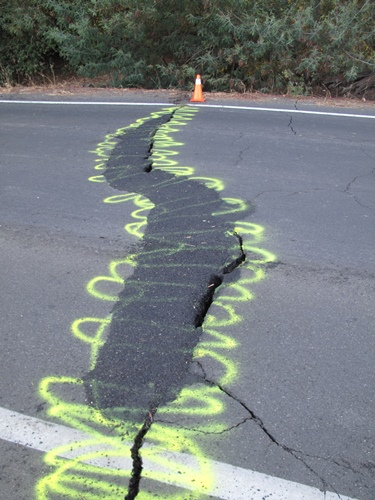
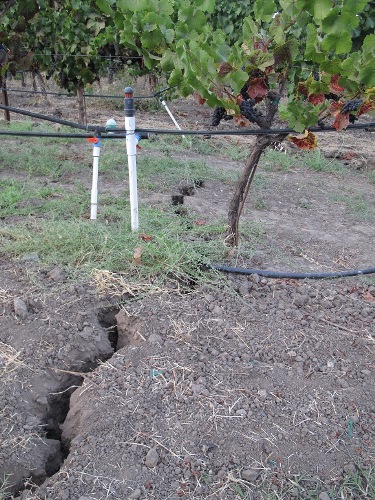
Figure 12: Roadway buckling on off Hwy 12, heading towards epicenter in Cuttings Wharf. Vertical displacement of approximately 3”, horizontal splitting of approximately 6”. Temporary repair completed before time of inspection.
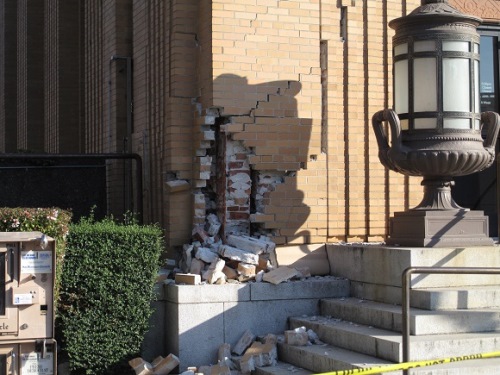
Figure 13: Post office in downtown Napa, of apparent URM construction, with heavy structural damage and significant brick façade spalling. Stepped shear cracks noted at most column bases. Red tagged.
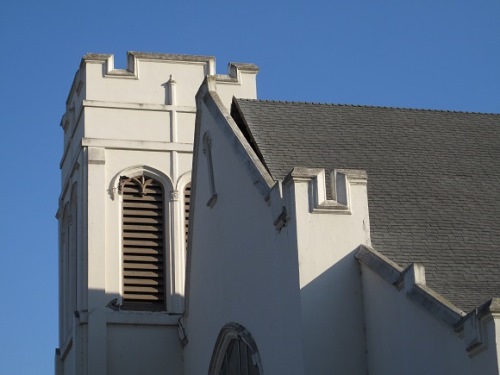
Figure 14.Exterior wall anchorage failure; upper façade leaning outward from building of church. Red tagged.
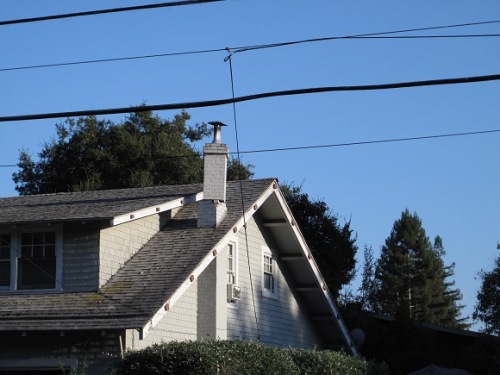
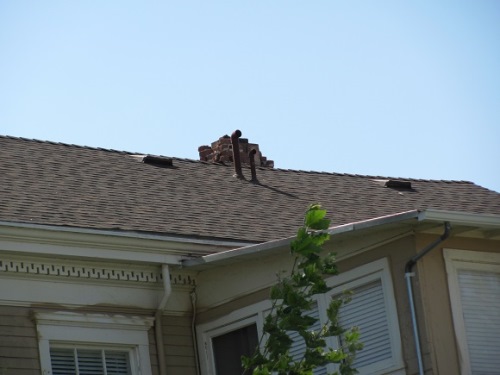
Figure 15: Examples of varying levels of chimney damage in residential structures. Typical partial chimney failure (top); Typical complete chimney failure (bottom)
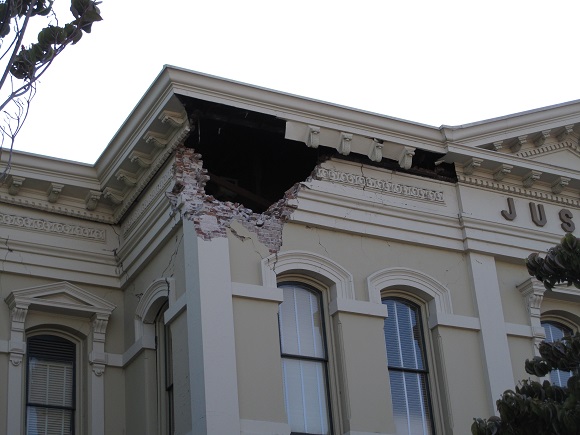
Figure 16: Historic courthouse is badly damaged on northeast side of building. Collapse of URM wall at NE corner; significant shear cracking at reentrant corners and throughout exterior walls. Southeast side of building exhibits much less exterior damage. Red tagged.
In general, the damage seen was characteristic for this level of shaking (chimney failure, URM damage, façade damage, contents damage, etc.).