Hurricane Florence 2018
Status: Closed
Post Landfall 2 | Summary
Posting Date: September 21, 2018, 1:30:00 PM
Hurricane Florence made landfall as a Category 1 storm on Friday, September 14 at 7:15 a.m. near Wrightsville Beach, North Carolina. By noon Friday, the storm had reached a near crawl, moving at just 3 mph, about 25 miles southwest of Wilmington, North Carolina. With very weak upper-level winds to help move the storm out of the region, Florence continued to drop heavy rainfall over eastern and coastal North Carolina through Saturday, moving at only 2 mph just 40 miles west of Myrtle Beach.
ALERT subscribers can download inundation shapefiles—for use in Touchstone® and GIS applications—for on-floodplain flooding from Florence in North Carolina and South Carolina, as well as a list of affected ZIP Codes and Touchstone event sets. These files capture the on-floodplain flooding caused by Florence in North Carolina and South Carolina through Thursday, September 20. In addition, a brief description of the methodology and data sources used in the development of the files is provided.
The slow movement of the storm was only one aspect of the storm that led to record-breaking rainfall totals. The long fetch of moisture flux convergence over the warm sea-surface temperatures (SSTs) of the Gulf Stream combining with frictional convergence over land further enhanced precipitation across the region lasting through Sunday.
Eventually, the remnants of Florence were advected in much stronger steering currents across the Appalachians and the Northeast, but not before dropping record rainfall across the Carolinas where totals ranged from 12 to 36 inches. Some notable totals in North Carolina include: 34 inches in Swansboro, 36 inches in Elizabethtown, and 30 inches in Gurganus. In South Carolina, the precipitation totals were slightly less, but still remarkable, with Loris recording 23.6 inches, Cheraw 22.6 inches, and Carolina Sand Hills 21 inches. These values translated to recurrence intervals for 72-hour accumulated precipitation on the order of 1 in 1,000 years across most of eastern North Carolina as well as parts of northern South Carolina. Moreover, the storm broke the record for most rainfall ever recorded from a tropical cyclone in both North Carolina (36 inches in Elizabethtown) and South Carolina (23.6 inches in Loris). As a result, the storm has already ensured that Wilmington, North Carolina, will have its wettest year on record (86.22 inches) with another three months of the year remaining.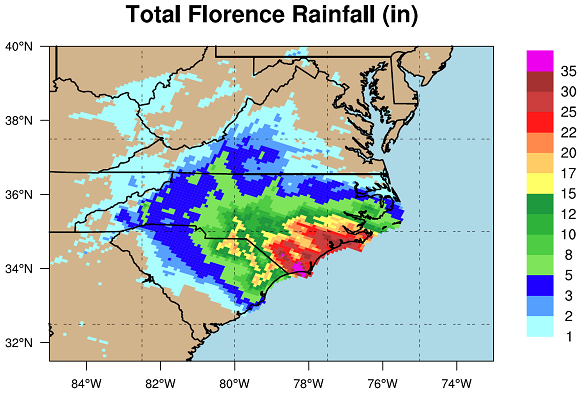
Figure 1: Total rainfall (inches) from Florence for the period of 09/14 00UTC to 9/19 00UTC. (Source: NOAA/NWS)
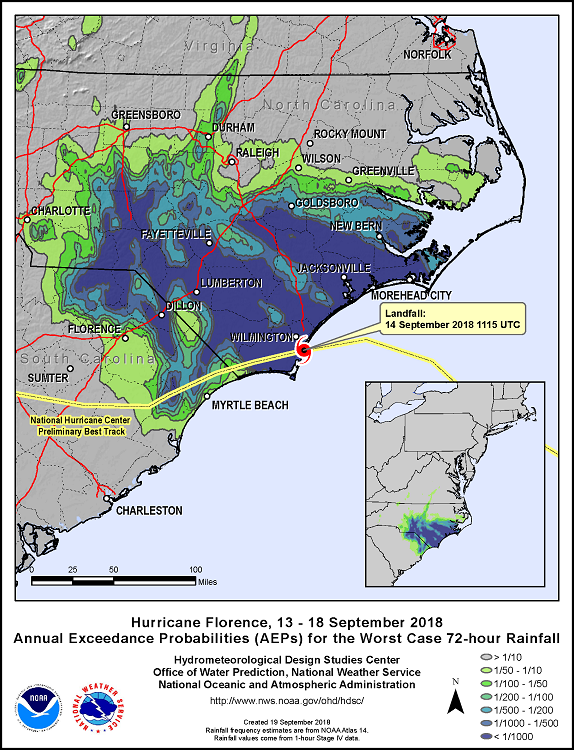
Numerous rivers in the impacted region crested above major flooding stage, and a few exceeded their historic levels. Neuse River at Kinston; Cape Fear River at W.O. Huske Lock and at Fayetteville; N.E. Cape Fear River near Burgaw; Waccamaw River near Conway; Lumber River at Lumberton West 5th Street; Pee Dee at Cheraw River; and Trent River at Trenton all crested beyond major flooding stage. N.E. Cape Fear River near Burgaw crested at 25.57 feet, over 3 feet higher than the historic peak from 1999; Cape Fear River at Lock 1 is likely to crest at 30.6 feet, which is higher than the 1945 record, and Trent River at Trenton crested at 29.25 feet, higher than the 1999 historic crest at this location. The flow rates in a number of river segments of the Cape Fear River, Lumber River, and Trenton River exceeded the 100-year return period flow magnitudes and caused significant flooding.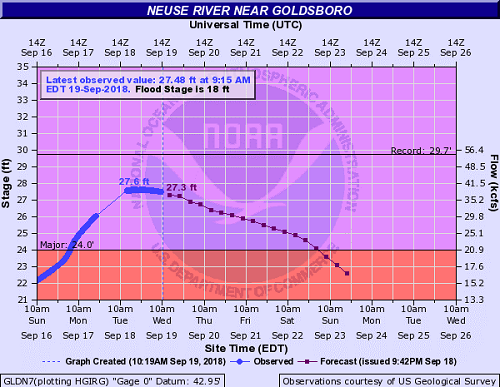
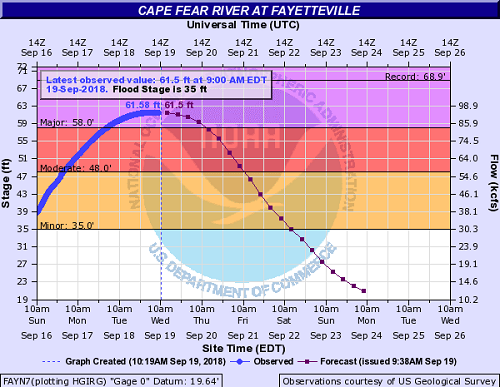
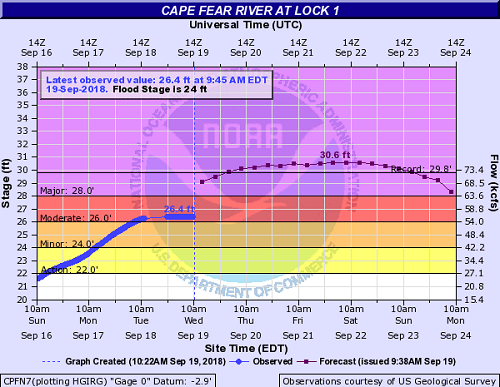
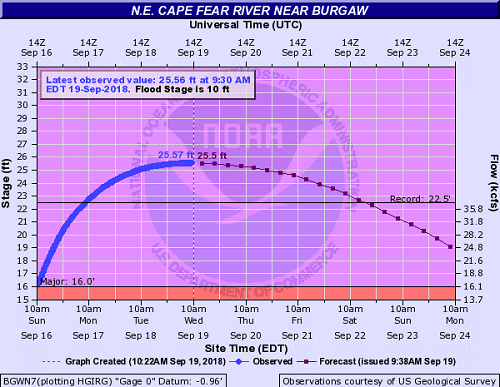
Figure 3. Neuse River near Goldsboro, Cape Fear River at Fayetteville and at Lock 1, and N.E Cape Fear River near Burgaw all rose much beyond their respective major flooding stages. (Source: National Weather Service)
Reported Damage and Distruption
Towns and communities throughout the Carolinas have been inundated, making it difficult to assess the damage caused by on-floodplain flooding from Florence. Preliminary reports relate that many roads are impassable, barricaded, or washed away, cutting off some communities. More than 1,000 roads in North Carolina alone have been closed, and officials are warning that sinkholes may have developed under some submerged roads. Some sections of interstates closed, including I-40 and I-95 in North Carolina, although the latter reopened at 11 a.m. on Wednesday, September 19. The Defense Department assigned 13,500 military personnel to support rescue and relief efforts.
More than 1 million people lost power at the height of the storm. While officials have been working to restore power, flooded roads are restricting access, and some areas may be without power for weeks, according to Duke Energy officials. More than 53,600 U.S. homes and businesses, mostly in North Carolina and South Carolina, were still without power on Wednesday, power companies said.
The Cape Fear River at Fayetteville, North Carolina, about 100 miles inland, crested Tuesday at over 61.5 feet—26.5 feet over its flood stage—breaking the 58.94 ft record flooding from Hurricane Matthew. Fayetteville authorities have reportedly closed a vehicle bridge after the water reached support girders—long-term effects to bridges will be evaluated after the water levels fall.

Four dams have breached in North and South Carolina, FEMA officials said Tuesday morning: Chatham Lake, Spring Lake, and Lake Darpo dams in South Carolina and the Lilesville dam in North Carolina, which prompted some evacuations. Officials said assessments are ongoing at other "high-hazard” dams – those with a high likelihood of impacts to people and homes if breached.
ALERT subscribers can download inundation shapefiles—for use in Touchstone® and GIS applications—for on-floodplain flooding from Florence in North Carolina and South Carolina, as well as a list of impacted ZIP Codes and Touchstone event sets. These files capture the on-floodplain flooding caused by Florence in North Carolina and South Carolina through Thursday, September 20. In addition, a brief description of the methodology and data sources used in the development of the files is provided.
Post Landfall 2 | Downloads
Posting Date: September 21, 2018, 1:30:00 PM
Simulated Event Set
Note: The "All simulated scenarios" set consists of all the events simulated by AIR using the event's actual parameters. The "Select simulated scenarios" set consists of a subset of the full distribution that is most representative of the range of potential industry losses.
| Product | Version | Description | Download |
|---|---|---|---|
| TOUCHSTONE | 5.1_6.0 | Selected set of simulated scenarios | |
In Touchstone v6.0 the auto damage functions have been adjusted to incorporate this type of precipitation after our findings from Hurricane Harvey. This is the reason why loss modification factors are not needed in v6.0 of the AIR U.S. Inland Flood Model.
Below are instructions on how to apply the LMF template in Touchstone v5.1:
- Open a new detailed loss analysis and select the pencil to the right of the Loss Modification Factor dropdown menu. This will prompt the Loss Modification Factor Template Manager to appear.
- Click the import button in the top left corner of manager and select the template.
- Save and close out of the manager.
- Select the template from the dropdown menu and preform a detailed loss analysis.
Additional Downloads
Note: Additional downloads related to the posting are listed below. Please use the appropriate application to view these files.
| Title | File Type | Description | Download |
|---|---|---|---|
| Hurricane_Florence_Inland_Flood_Impacted_ZIP_Codes | .xlsx | Excel file containing a list of potentially affected ZIP Codes. | |
| FlorenceFlood_September2018_FloodMapsMethodology | Document containing a description of the methodology AIR used to produce the Hurricane Florence flood inundation and depth bin shapefiles. | | |
| AIR_HurricaneFlorenceFlood_2018_DepthBins | .zip | The AIR Hurricane Florence flood inundation and depth bin shapefiles have been built to work with standard GIS software packages, but have not been optimized to work within the Touchstone environment. | |
| AIR_HurricaneFlorenceFlood_2018_DepthBins_SPLIT4 | .zip | Touchstone v5.1 and v6.0 compatible shapefiles showing the Hurricane Florence flood inundation and depth bands in localized areas of both North Carolina and South Carolina, along with instructions for importing the shape files into Touchstone. We recommend running these shapefiles individually in Touchstone to improve performance. | |
| Hurricane_Florence_Auto_Adjustment_Factor | .zip | Hurricane Florence Inland Flood Loss Modification Template to be used in Touchstone v5.1 | |