
M7.8 Turkey Earthquake
Status: Closed
| Type of posting | Posting date(EST): | Summary | Downloads |
|---|---|---|---|
| Post-Event Analysis | 2/14/2023 5:00:00 AM |
|
|
| Similar Stochastic Events | 2/6/2023 2:00:00 PM |
|
|
Post-Event Analysis | Summary
Posting Date: February 14, 2023, 5:00:00 AM
Verisk estimates economic losses for the February 6, 2023 earthquakes in Turkey will likely exceed USD 20 billion (TRY 375 billion; EUR 18 billion), and industry insured losses will likely exceed USD 1 billion. There is a higher degree of uncertainty than usual in estimation of industry insured losses for this event; see discussion below.
ALERT™ subscribers can now download Touchstone® and Touchstone Re™ event sets, loss-based similar stochastic events (SSEs), and a ground motion footprint shapefile of the median industry loss event for impacts to Turkey from the February 6, 2023 earthquakes from the Downloads tab for this posting on the ALERT Website. The loss-based SSEs are recommended for exposures in Turkey. The information provided herein is strictly confidential and is solely for the use of Verisk clients; disclosure to others is prohibited unless noted in your Verisk software license.
Modeling Information and Assumptions
The modeling and insured industry loss estimate explicitly captures damage from ground shaking induced insured physical damage to property (residential, commercial/industrial), both structures and their contents, as well as loss of use coverages such as business interruption. The range in loss estimates reflects uncertainty in the slip distribution on the fault plane, modeled ground motion, and damage estimation. The assumed exchange rates are 1 TRY = 0.053 USD = 0.049 EUR.
The insured industry loss estimate for this event has been adjusted for insurance take-up rates as well as exposure growth and inflation. Clients who wish to use Touchstone Re to generate industry losses are advised to use the updated set of indexed take-up rates provided on the Downloads tab of this posting under the Additional Downloads header. These indexed take-up rates include adjustments to values since the last update of the Verisk Industry Exposure Database for Turkey, as well as exposure growth and inflation since the last release of indexed take-up rates for Turkey in 2020. While the updated indexed take-up rates have not been explicitly adjusted for changes in insurance take-up over this period, they have been validated against publicly available data from DASK. Clients using Touchstone to run detailed portfolios should make sure local currency values are up to date given the high inflationary environment. For more commentary on how the updated indexing for the take-up rates was derived, see the section below titled ‘Impact of Inflation and Economic Conditions in Turkey’.
The modeled scenarios contained in the Touchstone and Touchstone Re event sets and on which the loss estimates are based account for the impacts of both of the M7+ earthquakes in this sequence in a single event. While there remains some uncertainty at this time as to how this event will be handled by the industry at large, given the hours clause in this region is 72 hours, and given this approach is consistent with our handling of similar events in the past, we have treated these quakes as a single event for modeling purposes. While attributing losses to these two M7+ events is challenging at best, our modeling indicates the M7.8 (per USGS) initial shock is the driver of the vast majority of the insured losses.
There is a higher degree of uncertainty than usual in our industry loss estimate for this event, with the following factors contributing to this:
- Verisk’s estimates are based on assumptions about take-up rates in Turkey (the percentage of properties actually insured against the earthquake peril), which are uncertain.
- Recent changes to TCIP terms and conditions
- Inflation in Turkey continues to be quite significant. The annual inflation rate as of January 2023 was at 58% and ran significantly higher for much of 2022. The development of claims in this extreme inflationary environment could drive insured losses higher.
- The amount of exposure growth in recent years
Given the additional uncertainty in industry losses, clients are encouraged to run detailed portfolios in Touchstone or market share analyses in Touchstone Re with the latest view of values wherever possible.
Verisk’s modeled insured loss estimates do not include:
- Losses due to fire-following, liquefaction, or sprinkler leakage
- Loss adjustment expenses
- Losses to uninsured properties
- Losses to infrastructure
- Losses from extra-contractual obligations
- Losses from hazardous waste cleanup, vandalism, or civil commotion, whether directly or indirectly caused by the event
- Losses outside of the model domain, including those in Syria
- Losses to civil engineering (railway) risks, marine cargo and marine hull risks, aviation risks
- Risks, Transit warehouse risks, movable all risk, and personal accident risks
- Other non-modeled losses
Event Overview
The February 6, 2023 M7.8 earthquake resulted from strike-slip faulting at shallow depth. According to the moment tensor solution, modeled/observed slip, and the aftershock distribution, the event ruptured a near-vertical left-lateral fault striking northeast-southwest. The location of the earthquake places it within the vicinity of a triple-junction between the Anatolia, Africa and Arabian tectonic plates. According to the USGS’s finite fault model slip occurred as far north as the cities of Malatya and Adiyaman in Turkey and as far south as the Turkey/Syria border, a length of about 330km and a width of about 20km. However, there is evidence that some smaller events (M<5) may have been triggered on the same or adjacent fault system as far south as Lebanon and as far north as the intersection of the rupture fault with the Bitlis-Zagros Fold and Thrust Belt in Turkey. Nine hours after the first earthquake of M7.8 a second earthquake of M7.5 occurred 100 km to the north on a separate but connecting fault. According to the moment tensor solution, modeled/observed slip, and the aftershock distribution, the second event ruptured a high dipping left lateral striking east-west fault. Aftershock distribution along this fault spanned a length of 130 km and a width of about 30 km.
Seismicity in Turkey
Turkey has a high rate of earthquake occurrence. Since 1900, approximately 12 earthquakes of magnitude 5.0 and greater and one event of magnitude 6.0 and greater have occurred here each year. Turkey is located on the Anatolian Block, and most earthquakes here are the result of this crust being squeezed between the Arabian and Eurasian plates. This motion occurs along two major strike-slip faults, the North and East Anatolian faults, which together form the 1,300 km long North Anatolian fault (NAF) system. This fault system is the most significant of Turkey’s tectonic setting and has been responsible for some powerful and damaging earthquakes. Seven earthquakes of magnitude 7.0 and greater have occurred in the Anatolian fault between 1939 and 1999. Notable historical events in Turkey include the 1939 magnitude 7.9 İzmit earthquake, the 1999 magnitude 7.5 İzmit earthquake, and the 1999 magnitude 7.2 Düzce earthquake. These events caused extreme devastation and massive loss of life throughout Turkey.
Building Stock and Code Enforcement
Turkey has a long history of building codes and regulations that have been developed to ensure the safety and performance of buildings against earthquakes. The first building code in Turkey was introduced in 1940s, which was later revised and updated in the 1950s and 1960s. Since then, several additional codes have been introduced and updated to reflect the latest advancements in building technology and seismic design practices almost in parallel with changes in the US seismic code.
Despite these efforts, the seismic performance of buildings in Turkey during earthquakes has been mixed. Buildings in compliance with codes have performed relatively well, while many others have experienced significant damage and collapse during earthquakes. This is due to a variety of factors, including higher than designed seismic demand, quality of construction and inappropriate seismic design.
Damage Observations
Although many advancements have been made in the past 20 years, history repeats in terms of damage between the 1999 Izmit earthquake and the recent one: widespread pancake-type collapse for both old and new buildings particularly for middle- and high-rise buildings. The reason is that this large magnitude earthquake generated strong shaking in the period of 1 – 2 seconds, and posted strong demand to mid- and high-rise buildings. In areas like city of Hatay, which is close to the rupturing fault, the shaking demand was so severe and beyond buildings were designed. However, in many cases, one or several buildings collapsed but neighboring buildings survived such as the one observed at Sanliurfa about 50 miles away from the fault. These poorly performing buildings are likely not designed to have sufficient ductility or built in a way with structural deficits such as soft story and a common Asmolen construction in Turkey (a form of reinforced concrete frame infill that has a joisted floor slab made of hollow cement cinderblock) which is found vulnerable to shaking. There are reports that buildings constructed in compliance with the latest earthquake regulations as recently as in 2018 and 2019 were shaken into rubbles and raises speculation how regulations are enforced.
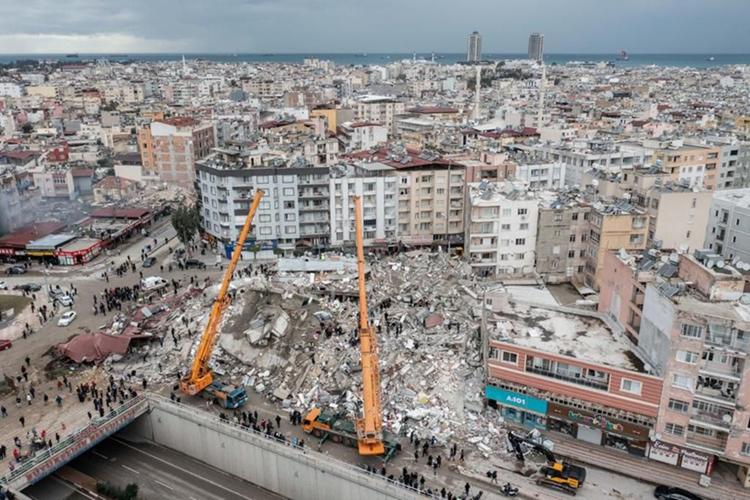
A damage scene at Hatay (Social Media)
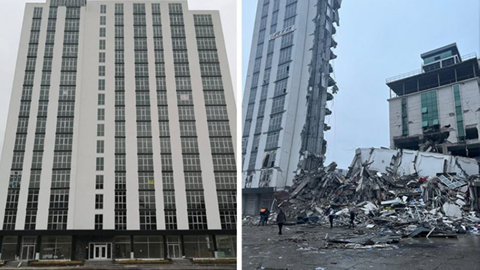
Before and after: A recently built apartment block in Iskenderun (BBC)
Impact of Inflation and Economic Conditions in Turkey
The Industry Exposure Database for Turkey’s indexed take up rates have been updated to reflect changes in the country’s exposure since it was last updated (in Turkish Lira). The estimated indexed take up rates included in this posting on the Downloads tab under the Additional Downloads header reflect this update. The index was derived using the Verisk Global Capital Stock Index. The Verisk Global Capital Stock Index measures the change in capital stock levels over time for more than 90 countries and regions included in Verisk’s extreme event models and is used to keep Industry Exposure Databases current between full updates. Capital stock values for the Verisk Global Capital Stock Index are derived using sufficiently long time series of capital stock investment data (a component of GDP) and reflect both inflation and new construction over time.
While new construction has grown significantly in Turkey in recent years, changes in exposure have been driven by a recent period of record-high inflation. In the years leading up to 2018, economic growth in Turkey was robust and the country experienced a prolonged building boom. In 2018, however, Turkey entered a still ongoing economic crisis characterized by record-high levels of inflation and rapid devaluation of the Turkish Lira. Since 2018, Turkey experienced double-digit increases in annual inflation. Inflation soared in 2022, with annual inflation exceeding 60 percent. Over this same period, the Turkish Lira (TRY) has lost significant value compared to the U.S. Dollar (USD) and Euro (EUR).
Insurance Market and TCIP
Earthquake insurance in Turkey is compulsory for property owners, and is issued by DASK, the country’s Foundation for Natural Disaster Insurance, via the Turkish Catastrophe Insurance Pool (TCIP). While private earthquake insurance in Turkey generally covers property features such as all primary walls, separating walls, garden walls, ceilings, floors, staircases, elevators, walkways, roofs, and property entrances, and other sources of loss such as contents and business interruption, TCIP policies only provide coverage on primary building. TCIP coverage has been increased most recently to a maximum of 640,000 TRY given recent inflation, and deductibles on TCIP policies are set at 2%. Hours clauses for earthquake in the region are generally set at 72 hours. Take up for earthquake insurance is significantly higher in urban areas, and the penetration in rural areas remains quite low, owing to a number of factors including cost and a lack of culture around purchasing insurance.
Post-Event Analysis | Downloads
Posting Date: February 14, 2023, 5:00:00 AM
The information provided herein is strictly confidential and is solely for the use of AIR clients; disclosure to others is prohibited.
Simulated Event Sets
Event sets for Touchstone and Touchstone Re containing five modeled scenarios of this event.
| Product | Version | Description | Download |
|---|---|---|---|
| TOUCHSTONE Re | 9 and 10 | Selected set of simulated scenarios | |
| TOUCHSTONE | 9 and 10 | Selected set of simulated scenarios |
Similar Stochastic Event IDs
These lists give event IDs taken from our stochastic catalog that have similar industry loss footprints as the current event.
| Product | File Type | Description | Download |
|---|---|---|---|
| TOUCHSTONE / Re | Excel (xls) | Selected set of stochastic events, with Readme in Excel format |
Additional Downloads
Additional downloads related to the posting are listed below. Please use the appropriate application to view these files.
| Title | File Type | Description | Download |
|---|---|---|---|
| Shapefile of Ground Motion Footprint | .zip / .shp | A shapefile of the median loss scenario (Event #3) ground motion (PGA in g) footprint | |
| Estimated Insured Industry Losses | .xlsx | A spreadsheet containing estimated insured industry losses for the five custom events, with Readme | |
| Updated Indexed Insured Take-Up Rates | .txt |
UNICEDE/2 import file containing updated indexed insured take-up rates for Turkey earthquake |