
M7.5 Anamizu, Japan
Status: Closed
| Type of posting | Posting date(EST): | Summary | Downloads |
|---|---|---|---|
| Post-Event Analysis | 1/9/2024 12:00:00 AM |
|
|
| Similar Stochastic Events | 1/2/2024 11:00:00 AM |
|
|
Post-Event Analysis | Summary
Posting Date: January 9, 2024, 12:00:00 AM
Verisk estimates that insured losses to properties from the January 1 M7.5 (per the United States Geological Survey) earthquake that struck near the Noto peninsula in Ishikawa prefecture, Japan, will be between JPY 260 billion (~USD 1.8 billion) and JPY 480 billion (~USD 3.3 billion).
ALERT™ subscribers can download Touchstone® and Touchstone Re™ custom event sets of five scenarios for this event, a Touchstone-ready shapefile of the estimated ground motion for the median scenario, a shapefile of the modeled tsunami inundation footprint, and loss-based similar stochastic events from the Downloads tab on the ALERT website. The information provided herein is strictly confidential and is solely for the use of our clients; disclosure to others is prohibited unless noted in your software license.
Modeling Assumptions
Verisk’s loss estimates are gross of government recoveries (i.e., prior to the application of the Japanese Earthquake Reinsurance scheme). They explicitly capture damage from ground shaking, liquefaction, tsunami, and fire following. Losses are dominated by shake damage in Verisk’s scenarios, with a very small contribution from the other modeled sub-perils. Note that Verisk’s estimates are based on assumptions about take-up rates in Japan (the percentage of properties actually insured against the earthquake peril), which are uncertain. The range in loss estimates also reflects uncertainty in the slip distribution on the fault plane, modeled ground motion and fire ignition, and damage estimation. The assumed exchange rate is 1 JPY = 0.0069 USD.
Two Touchstone Re event sets have been provided with this posting, reflecting different assumptions about policy conditions on our industry exposure database. One provides a “100% limits” view, and the other is the “Industry Policy Mix” (IPM). The IPM perspective in this posting includes residential line of business losses which are gross of government reinsurance recoveries and as such can be used to generate the industry loss range quoted above.
Verisk’s insured loss estimates include:
- Insured physical damage to onshore property (residential, commercial/industrial, mutual), both structures and their contents, and from ground shaking, fire-following, tsunami, and liquefaction
Verisk’s insured loss estimates do not include:
- Losses to uninsured properties
- Losses to land
- Losses to infrastructure
- Losses to automobiles
- Business interruption losses, both direct and indirect
- Workers’ compensation losses
- Losses to civil engineering (railway) risks, marine cargo and marine hull risks, aviation risks
- Risks, Transit warehouse risks, movable all risk, and personal accident risks
- Loss adjustment expenses
- Losses from non-modeled perils, such as landslide
- Demand surge—the increase in costs of materials, services, and labor due to increased demand following a catastrophic event
Hazard Summary
Per the United States Geological Survey (USGS), the January 1, 2024, M7.5 earthquake on the west coast of Japan, on the island of Honshu, occurred due to shallow reverse faulting in the Earth’s crust. Focal mechanism solutions for the earthquake indicate faulting occurred on a moderately dipping reverse fault striking to the southwest or northeast. Japan is a seismically active region, with most earthquakes occurring off the east coast, where the Pacific plate subducts beneath Japan. This earthquake occurred on the west coast of Japan where crustal deformation created by the broader plate motions is accommodated in shallow faults. Shallow earthquakes cause more damage than intermediate- and deep-focus ones since the energy generated by the shallow events is released closer to the surface and therefore produces stronger shaking relative to earthquakes located deeper within the Earth. This coastal earthquake produced both strong shaking on land and generated a tsunami.
The USGS has also noted that while earthquakes are common in Japan, the region surrounding the January 1, 2024, earthquake sees lower rates of seismicity as compared to the major subduction zone along its east coast. Still, since 1900, 30 other M6 and larger earthquakes have occurred within 250 km of the January 1 event. Three of these occurred on or near the Noto Peninsula, where the January 1 event is located. On May 5, 2023, a M6.2 earthquake on the Noto Peninsula killed one person and damaged hundreds of buildings. On June 16, 1964, a M7.6 occurred 205 km east-northeast of the January 1 event, resulting in 36 fatalities and roughly 3,500 destroyed homes.
Vulnerability Summary
The earthquake caused damage across an extensive area around and south of the epicenter. While most of heavy damage occurred in Ishikawa prefecture and in particular Wajima city including a large fire, damage from ground shaking and liquefaction was observed in other prefectures such as Niigata and Toyama. Tsunami waves of over one meter inundated many buildings along the shore, especially in Wajima, Suzu, and Noto.

A collapsed home in Shika, Ishikawa prefecture (KYODO)
Building codes in Japan are among the most advanced in the world and have been adopted and practiced well since 1981. In the areas impacted by 2024 Noto Peninsula earthquake, seismic code requirements are higher than those in the southern part of Japan. However, extensive shaking damage was observed in coastal towns like Wajima, Suzu and Noto in the prefecture of Ishikawa due to severe shaking close to rupture area. Hundreds of buildings collapsed, including a seven-story reinforced concrete building, though most of those buildings which collapsed were older wood frame residential structures. Roads were cracked by liquefaction and bridges crumbled cutting off access to some areas. As of Friday the 5th of January, there were still more than 25,000 buildings without power in Ishikawa prefecture.
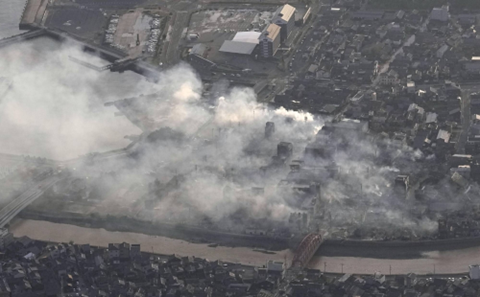
Smoke from an earthquake induced fire in Wajima, Ishikawa prefecture (KYODO)
Impacts to Other Industries
According to a Reuters report, about 80% of 200 companies with plants in the quake-hit areas, including makers of machines, semiconductors, and textiles, had resumed or would soon resume production as of Friday the 5th of January, per Industry Minister Ken Saito. Electronic parts supplier Murata Manufacturing on Friday said it was examining the damage at five plants in Ishikawa and neighboring Toyama, while eight other plants in the region have resumed production or would do so by Tuesday.
Display makers Japan Display and EIZO, as well as chipmakers Kokusai Electric, Sanken Electric and Toshiba Electronic Devices & Storage, have said they were checking and repairing damaged factory facilities. Toyota was looking into how its production might be affected after its suppliers Aisin and Sumitomo Electric Industries suffered some damage from the earthquake.
According to Trendforce, the timing of the earthquake may be a silver lining for chip and related supply chain disruption. The market intel firm said the impact of the earthquake on the industry is "manageable," accrediting this to a current downturn in the semiconductor industry, paired with the off-season period, low component inventories, and the fact that most factories are located in areas with seismic intensities of level 4 to 5 therefore did not suffer much infrastructure damage.
The Nuclear Regulations Authority has reported no abnormalities at nuclear plants along the affected area of the Sea of Japan.
No additional ALERT postings are planned for this event. Please contact your Verisk representative with any questions.
Post-Event Analysis | Downloads
Posting Date: January 9, 2024, 12:00:00 AM
The information provided herein is strictly confidential and is solely for the use of Verisk clients; disclosure to others is prohibited.
Simulated Event Sets
These event sets contain five custom modeled scenarios for the January 1 earthquake near Japan, allowing for uncertainty.
| Product | Description | Download |
|---|---|---|
| Touchstone Re | Selected set of simulated scenarios for 100% Limits and Industry Policy Mix (IPM) perspectives | |
| Touchstone | Selected set of simulated scenarios |
Industry Loss Based Similar Stochastic Event IDs
These stochastic events were selected as best matches to the insured industry loss footprints generated by the custom modeled scenarios in the Simulated Event Set.
| Product | File Type | Description | Download |
|---|---|---|---|
| Touchstone / Re | Excel (xls) | Selected set of stochastic events, with Readme in Excel format | |
| Touchstone / Re | CSV (csv) | Selected set of stochastic events, formatted for import into Touchstone/Re |
Additional Downloads
Note: Additional downloads related to the posting are listed below. Please use the appropriate application to view these files.
| Title | File Type | Description | Download |
|---|---|---|---|
| Modeled Ground Motion Shapefile | .zip | A shapefile for the median loss scenario ground motion footprint from the Simulated Event Set, in PGA (g) | |
| Modeled Tsunami Inundation Shapefile | .zip | A shapefile for modeled tsunami inundation footprint from the Simulated Event Set, units in meters | |
| Modeled Insured Industry Losses | .xlsx | Modeled insured industry losses for the five scenarios in the Simulated Event Set |