Hurricane Ian
Status: Closed
Post-Landfall Florida Wind and Surge | Summary
Posting Date: October 3, 2022, 6:00:00 AM
Verisk estimates industry insured losses to onshore property for Hurricane Ian will range from USD 42 billion to USD 57 billion. The industry loss estimate includes estimated wind, storm surge, and inland flood losses resulting from Ian’s landfalls in both Florida and South Carolina. The loss estimate excludes certain elements, such as losses to the NFIP and any potential impacts of litigation or social inflation, that could cause the total insured industry loss to exceed USD 60 billion.
ALERT™ subscribers can now download Touchstone® and Touchstone Re™ event sets, loss-based similar stochastic events (SSEs), and wind and surge shapefiles of the median event for the wind and storm surge impacts in Florida from Hurricane Ian from the Downloads tab for this posting on the ALERT Website. The loss-based SSEs are recommended for exposures in Florida. Please note that while the industry loss range includes wind, storm surge, and inland flood losses from both landfalls and all impacted states, the event sets, shapefiles, and similar stochastic events provided along with this posting only reflect wind and storm surge impacts in Florida. Exposures run in any state outside of Florida using the event sets will not generate any modeled loss. The information provided herein is strictly confidential and is solely for the use of Verisk clients; disclosure to others is prohibited unless noted in your Verisk software license.
Modeling Information and Assumptions
Included in the industry insured loss estimate are losses to onshore residential, commercial, and industrial properties and automobiles for their building, contents, and time element coverage, as well as the impact of demand surge.
The industry loss estimates also reflect Verisk’s best estimate of current labor and materials costs, leveraging data from our Property Estimation Solutions team; our analysis of these data suggest an inflation adjustment of 9% over the modeled results using industry exposures in Touchstone Re 2022 as of December 31, 2021. This adjustment has been applied only to the industry loss range quoted above and is not explicitly included in the Touchstone and Touchstone Re event sets. We recommend that clients evaluate, and if needed, make their own adjustments to replacement values or modeled ground up losses to account for inflationary market conditions. The industry loss estimates have also been adjusted for demand surge due to this event. Users should run Touchstone and Touchstone Re custom event sets for Ian with demand surge turned on in order to account for this impact.
Storm surge losses quoted in the industry loss estimate are reflective of 5% leakage assumptions on wind only policies for residential, renters, manufactured homes, and small commercial, industrial, commercial residential risks, and 100% coverage on larger commercial, industrial, and commercial residential risks and automobiles. Touchstone users who wish to test the sensitivity of these assumptions to their own modeled losses may adjust the leakage factors by line of business when setting up analyses.
The five custom modeled scenarios provided represent a range of potential outcomes for Hurricane Ian’s impacts. In particular, the lowest and highest loss scenarios represent possible outcomes which, while less likely, could happen, given the higher than usual uncertainty around various aspects of this event.
Wind is expected to contribute USD 38 to 51 billion to the loss, whereas storm surge (excluding NFIP) contributed USD 3 to 5.5 billion, and inland flood less than USD 1 billion. Approximately 1% of the total industry loss will come from the impacts of Ian’s South Carolina landfall. Further discussion of the impact of current market conditions on loss potential can be found in the ‘Other Considerations’ section of this summary, under the header ‘Inflation and Demand Surge’.
See below for additional information.
Verisk’s modeled insured loss estimates do not include:
- Losses paid out by the National Flood Insurance Program
- Losses exacerbated by litigation, fraudulent assignment of benefits, or social inflation
- Loss adjustment expenses
- Losses to inland marine, ocean-going marine cargo and hull, and pleasure boats
- Storm surge leakage losses paid on wind only policies due to government intervention
- Losses to uninsured properties
- Losses to infrastructure
- Losses from extra-contractual obligations
- Losses from hazardous waste cleanup, vandalism, or civil commotion, whether directly or indirectly caused by the event
- Losses resulting from the compromise of existing defenses (e.g., natural and man-made levees)
- Other non-modeled losses, including those resulting from tornadoes spawned by the storm
- Losses for U.S. offshore assets and non-U.S. property
Meteorological History of Ian
On Friday, September 23rd, the National Hurricane Center (NHC) designated Tropical Depression Nine, at the time located 300 miles south of the Dominican Republic. Tropical Depression Nine spent the 23rd traveling due west through the Caribbean Sea before being upgraded to Tropical Storm Ian at 11 pm EDT. By dawn on Saturday, September 24th, Ian was located 300 miles southeast of Jamaica with maximum sustained winds of 45 mph. During the day Ian continued moving westward and strengthened slightly by Saturday night, with maximum sustained winds increasing to 50 mph.
On Sunday, September 25th, Ian continued tracking towards the west-northwest through the Caribbean Sea, a few hundred miles south-southeast of Grand Cayman. Tropical Storm Ian began to intensify later in the day and was upgraded to a hurricane as of 5 am EDT on the 26th.
On Monday, September 26th, Hurricane Ian gradually intensified into a Category 2 Hurricane despite some mid-level dry air in the morning hours inhibiting more rapid intensification. Ian began to move more to the north-northwest by the evening hours as it was approaching the western coast of Cuba. Overnight into Tuesday September 27th, Hurricane Ian intensified into a Category 3 Hurricane as it made landfall over western Cuba around 4:30 am EDT. After making landfall in Cuba, Ian moved into the Gulf of Mexico and began strengthening again. Late Tuesday evening, Ian underwent an eyewall replacement cycle which temporarily halted its increasing intensity. However, Ian had sufficient time before its eventual Florida landfall to complete this eyewall replacement cycle, resulting in a significantly larger eye and a quickly strengthening storm. Ian reached its peak intensity on Wednesday, September 28th during the morning hours and into the early afternoon landfall as a high-end Category 4 hurricane with maximum sustained winds of 155 mph and a minimum central pressure of 937 mb.
Heavy rain, storm surge, and tropical storm conditions began across portions of southwest Florida late Tuesday afternoon, as Ian began to veer to the north-northeast. Overnight Ian slid past the Florida Keys, its center passing approximately 70 miles west of Key West. Despite receiving a glancing blow from Ian, Key West recorded its third-highest storm surge since 1913 at just over 3 feet and peak wind gusts into the upper-60s mph. Conditions deteriorated rapidly in western Florida as Wednesday morning progressed, with heavy rainfall spreading northward and major-hurricane-force winds from Ian’s eyewall coming onshore late morning near Fort Myers Beach and Sanibel Island. To the south, in Naples and surrounding areas, Ian’s powerful winds were oriented perpendicular to the coast, which exacerbated the water inundation caused by storm surge as water from the Gulf was effectively blown inland. As a result, Naples saw over 6 feet of catastrophic storm surge, shattering the previous record. Ian officially made landfall at Cayo Costa, Florida at 3:05 PM local time as a Category 4 hurricane with a minimum central pressure of 940 mb and maximum sustained winds of 150 mph. Around this time, a 124-mph wind gust was observed in Punta Gorda before the station failed. Ian then slowly proceeded inland, following a northeasterly track that led the storm’s massive 30-mile-wide eye (wider than the east-west extent of Lake Okeechobee) over Gasparilla Sound and Punta Gorda. Owing to the storm’s slow motion, areas like Port Charlotte and Englewood remained in Ian’s eyewall for several hours; this resulted in 18 – 20 inches of rainfall in addition to prolonged exposure to the powerful wind gusts located in Ian’s northwestern eyewall. Ian managed to stay about 65 miles southwest of Tampa, which owing to Ian’s large wind field was still close enough to bring wind gusts into the upper-70s mph and 2 – 5 inches of rainfall; before that, Tampa Bay was temporarily drained of water because of inverse storm surge from Ian.
By 8pm local time on Wednesday, located about 25 miles southwest of Sebring, Ian was still a Category 3 hurricane, though quickly weakening. Shortly after 2am on Thursday, September 29th, Ian was downgraded to a tropical storm. During this time, 8 – 14 inches of heavy rainfall and hurricane-force winds battered central Florida, resulting in significant flooding along a northeast corridor from Orlando to Daytona Beach early Thursday morning. On Thursday morning, Ian moved off the Atlantic coast near Cape Canaveral – a bit further south than previously expected. By the time Ian moved off the coast, the storm left over 2.6M customers without power in Florida. As Ian moved back over the ocean on Thursday, conditions were favorable enough for some additional strengthening and Ian was upgraded to a hurricane as of Thursday evening.
On Friday, September 30th, Ian continued to move northward toward the coast of South Carolina. Significant storm surge caused flooding in several coastal cities from northern Florida northward to the Carolinas. Ian made a second landfall on Friday afternoon at 2:05 pm EDT near Georgetown, SC as a mid-range Category 1 hurricane with maximum sustained winds of 85 mph. Heavy rainfall and strong gusty winds of more than 50 mph impacted portions of the Carolinas. With these impacts ongoing, Ian was officially declared post-tropical at 5pm as the center moved into northeast South Carolina.
On Friday night and into Saturday, October 1st, the post-tropical remnants of Ian continued moving northward into central North Carolina and to near the North Carolina and Virginia border. Gusty winds continued but generally weakened throughout this time period as the system continued to weaken. Still, hundreds of thousands lost power throughout the Carolinas and into Virginia. Heavy rainfall of 3 to 6 inches, with locally higher amounts, fell across eastern and central portions of the Carolinas and into southeast Virginia.
Validation of Verisk’s Modeling of Ian
Wind and Storm Surge Damage
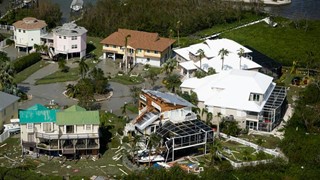
Wind damage in varying degree was observed in all the areas impacted by Hurricane Ian’s windfield. Damage was more severe in and around the areas where Ian made landfall in southwest Florida. It ranged from significant loss of roof covers in residential homes to torn up roof membranes in commercial structures, as shown in the figure below. Extensive damage is also seen to elements of building components and cladding.
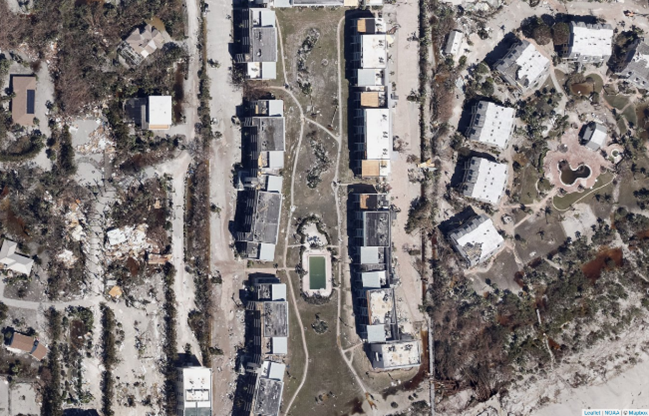
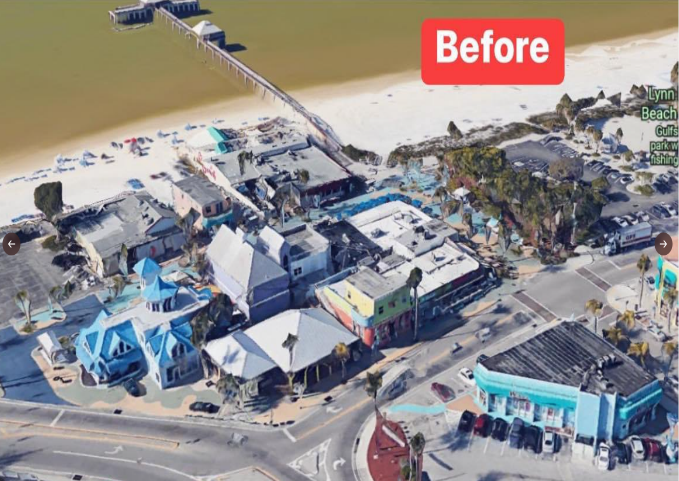
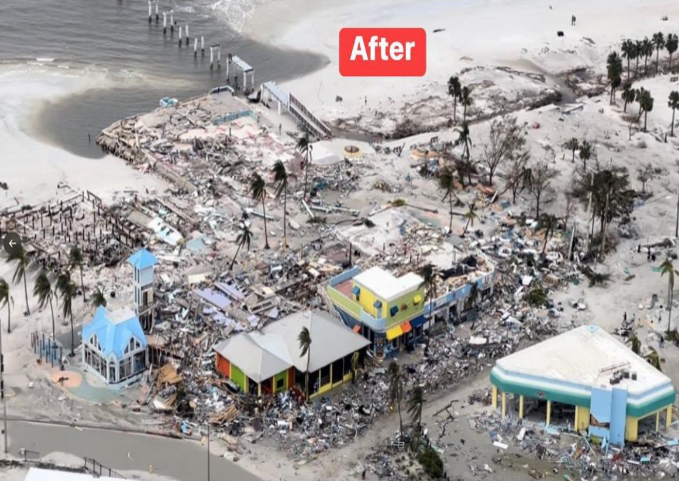
Storm surge caused massive destruction to communities along the western coast of Florida where Ian made landfall. Residential construction in these areas are predominantly founded on slabs which do not afford a lot of elevation above the local ground surface. Surge damage caused collapse of several rows of beachfront residential homes. In some cases, homes were dislodged from their foundations. Several commercial properties reported significant flooding to their lower floors in areas as far as Downtown Fort Myers. The figure below shows before and after images of Fort Myers Beach, Florida and highlights the significant surge and wind damage in this neighborhood.
Southwest Florida has many homes in affluent neighborhoods which sees a higher concentration of appurtenant and attached structures in comparison to other regions in the state. These include pool screened enclosures, in many instances pleasure boat docks or sheds. Appurtenant structures including screened enclosures also saw significant damage, often including complete destruction in some of the hard-hit areas. Enclosures that are physically connected to the home tend to also inflict damage to the wall siding and propagate the same to the roof. The figure below shows an aerial image of complete damage to screened enclosures in Cape Coral, FL.
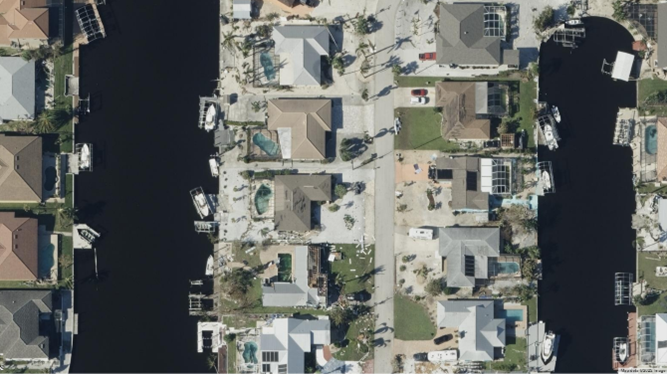
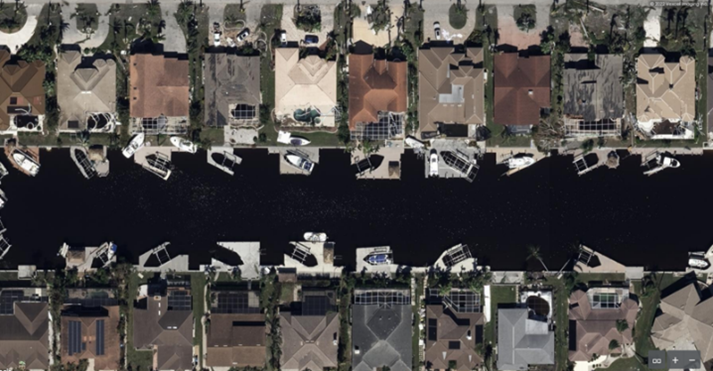
Figure: Aerial images showing significant damage to screened enclosures in Cape Coral, FL (Source: Vexcel)
Manufactured homes constitute a significant portion of the residential inventory in southwest Florida when Ian made landfall. Several manufactured home parks in these areas saw massive damage including loss of roofs, damage to wall siding and near total destruction. The figure below shows significant damage to manufactured homes in a community between north of Fort Myers Beach, FL.
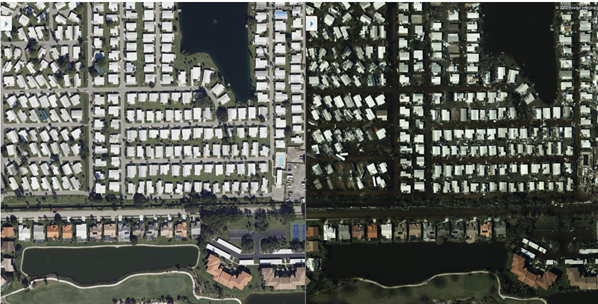
Figure: Several manufactured homes destroyed in a community north of Fort Myers Beach, FL (Source: Vexcel)
Putting Damage in Perspective from the Context of Building Codes
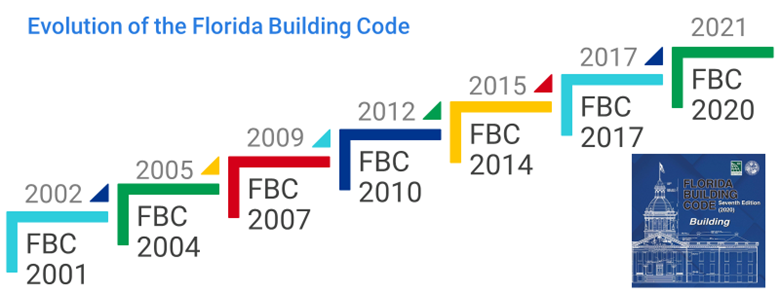
Florida has a long history when it comes to the evolution and adoption of building codes. Right from its very first adoption of the statewide building code in 2002, it has been a pioneer nationally in wind design specifications. The figure below shows the timeline of Florida Building Code (FBC) adoption.
The building code stipulated wind speeds that guide the design of residential and commercial buildings in southwest Florida are in excess of 150 mph (3-sec gust values) across these code versions. Further, vast swaths of areas where Ian made landfall fall under the windborne debris regions which require openings to be protected. Wind speeds that were observed in areas impacted by hurricane Ian, at landfall and further inland, fall well below the design levels. While the previous section detailed damage mechanisms that were observed, it is noteworthy that many residential and commercial buildings in these impacted areas fared well, in line with expectations.
It is also important to put damage in perspective by considering the age distribution of buildings in these impacted areas. The figure below shows the age breakdown of residential homes across several counties in southwest Florida. More than 50% of the risks are built before the first version of the FBC came into effect.
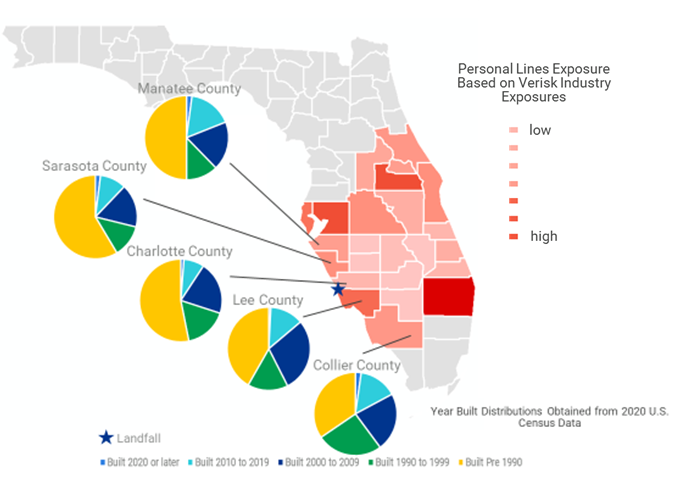
Figure: Age distribution of residential single-family homes in select counties of southwest Florida where Ian made landfall. The background colors show the total insured values for these same risks from Verisk’s industry exposure database (Source: Verisk and U.S. Census)
While a significant portion of the inventory is over 20 years old, it is important to look at roof age statistics since roofs are the first lines of defense when it comes to wind. The figure below shows the roof age distributions in this same area for buildings built before 2000. We see that a significant portion of these risks have been reroofed within the last decade. Additionally, at least 65% or more of these roofs have been newly built or reroofed in the FBC era.
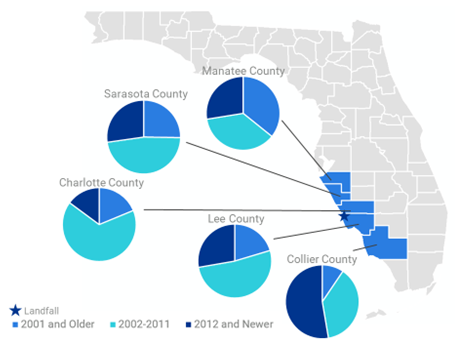
Figure: Roof age distribution of residential single-family homes built before 2000 in select counties of southwest Florida where Ian made landfall (Source: Verisk)
When it comes to appurtenant structures such as screened enclosures, these are designed to much lower levels in comparison to the main building. Typically, for these design levels are in the order of 140 mph (3-sec gust values). The relatively flimsy nature of materials that go into their construction combined with aging and deterioration impacts make these more vulnerable to damage. Further, the wind speeds that Ian brought to some of the impacted areas right around landfall exceed their design levels leading to widespread damage to these.
Manufactured homes on the other hand are designed and constructed using the federal Housing and Urban Development (HUD) standards. These standards have not changed since 1995 and specify design levels of 110 mph (fastest mile) without any additional safety factors. This is equivalent to approximately 130 mph on 3-sec gust basis. The wind speeds that Ian brought to some of the impacted areas right around landfall exceed their design levels leading to widespread damage to these.
Verisk utilized multiple NOAA and USGS tide and river gauges to validate our storm surge damage estimate. In addition to these gauges, Verisk analyzed hundreds of news, social media, and NOAA storm reports to better estimate the extent and severity of storm surge inundation. This effort was aided by our use of crowdsourced data collected by the Photomappers program run by URISA's GISCorps, NAPSG Foundation, and CEDR Digital Corps. Following the storm’s departure from Florida, we also examined aerial imagery from both NOAA and the Vexcel Data Program, which is discussed in a separate section below.
Of particular focus was validating the magnitude and extent of Verisk’s modeled storm surge inundation in the greater Fort Myers and Naples areas. It should be noted that the NOAA tide gauge at Fort Myers is in the Caloosahatchee River near downtown Fort Myers and is therefore not representative of the water levels reached on Fort Myers Beach; some media reports fail to distinguish properly between Fort Myers and Fort Myers Beach, especially when referencing that gauge. Also, the NOAA tide gauge at Naples failed during the event, so a reading of maximum surge was not recorded there.
Overall, Verisk’s modeled water depths are consistent with reported flooding, particularly in Fort Myers Beach and Downtown Naples where the destructive flooding of central business districts drew significant media attention. Reported flooding along Estero Boulevard in Fort Myers beach, for example, was more than 10 feet in places, an intensity captured by our modeled range of flooding. Some uncertainty remains regarding the overall inundation extent, particularly in the non-coastal areas of Fort Myers, Cape Coral, and Naples; our modeled event set covers that range of uncertainty.
Other Considerations
Inflation and Demand Surge
Construction costs have increased dramatically since the onset of the COVID-19 pandemic for a variety of reasons. On the labor side there has been a shortage of workers, some who left the work force, some recovering from COVID and others facing barriers to entry for seasonal workers. On the material side, there has been a shortage of materials that has been exacerbated by supply chain disruptions both domestically and internationally. Recent efforts by the Federal Reserve Bank to raise interest rates have started to quell the excess demand from the housing construction industry, but the effects have yet to filter through to the input markets.
As a result, according to data from Verisk Property Estimating Solutions, reconstruction costs are more expensive today than they were a year ago. The increase in the total reconstruction cost index means that costs are higher on average nationally and will affect both low- and high-severity events. The difference in magnitude of the impact will come from the mix of construction materials used. For example, minor wind losses are less likely to require repairs that use more expensive inputs such as structural lumber; however, dwellings that are a total loss would require a broader mix of inputs that reflect the higher increases indicated by the total reconstruction index. These increases are outside the scope of demand surge, which tries to answer the cost increase question from a post–extreme event perspective. Therefore, companies should bear these increases in mind and should expect the average claim to be higher for this reason before considering demand surge.
National Flood Insurance Program
Hurricane Ian brought significant storm surge damage to southwest Florida, to both residential and commercial exposures. However, the flood insurance take-up on residential risks in Florida are low. According to a study by Milliman, in the counties whose residents were told to evacuate, just 19 percent of homes have coverage through the National Flood Insurance Program. Within those counties, homes inside the government-designated floodplain, the area most exposed to flooding, 47 percent of homes have flood insurance, Milliman found (across the state as a whole, the proportion is a similar 49%). In areas outside the floodplain — many of which are still likely to have been damaged by rain or storm surge from Ian — only an estimated 9 percent of homes have flood coverage.
Homeowners who choose to purchase flood insurance most commonly do so through the National Flood Insurance Program (NFIP), and Florida has the highest proportion of NFIP policies of any state – about 35%, according to Fitch Ratings. These policies typically cover up to $250,000 in damages and do not include additional living expense coverage, suggesting that even for some homeowners with flood insurance, there may be a gap between coverage and rebuilding costs. While the ultimate impacts to the NFIP are yet to crystallize, a study by Fitch indicated that Hurricane Ian could possibly trigger private market reinsurance coverage of the NFIP.
Litigation, Social Inflation, Assignment of Benefits
Social inflation and assignment of benefits could also further drive losses even higher. Both phenomena have been seen in recent catastrophe events in Florida. Social inflation impacts have generally been most prevalent in recent years in commercial auto, liability, and medical malpractice claims, but remains a potential factor in losses from Ian. The Florida Legislature passed a bill in 2019 aiming to curb some of the worst abuses of the assignment of benefits law, though it remains to be seen how effective these will be in limiting additional losses due to litigation. The combined impacts of these factors could be significant drivers of additional losses from Ian, though a great deal of uncertainty exists around the specifics. To reiterate, these factors are not included in Verisk’s loss estimates for Ian.
Other Verisk Resources for Hurricane Ian
Aerial Imagery of Impacted Areas
Vexcel Data Program, the world’s largest aerial imagery program, is providing Verisk high-resolution aerial imagery and damage assessment on buildings and properties impacted by Hurricane Ian. Vexcel, along with its partner the Geospatial Insurance Consortium (GIC), have activated a full response to Hurricane Ian by deploying multiple fixed-wing aircraft to collect high-resolution aerial imagery. Imagery is captured with Vexcel’s market-leading cameras then put through its world-class processing pipeline and delivered within 24 hours post-collection. This Gray Sky disaster imagery will help Verisk customers better understand which properties are affected and to what degree.
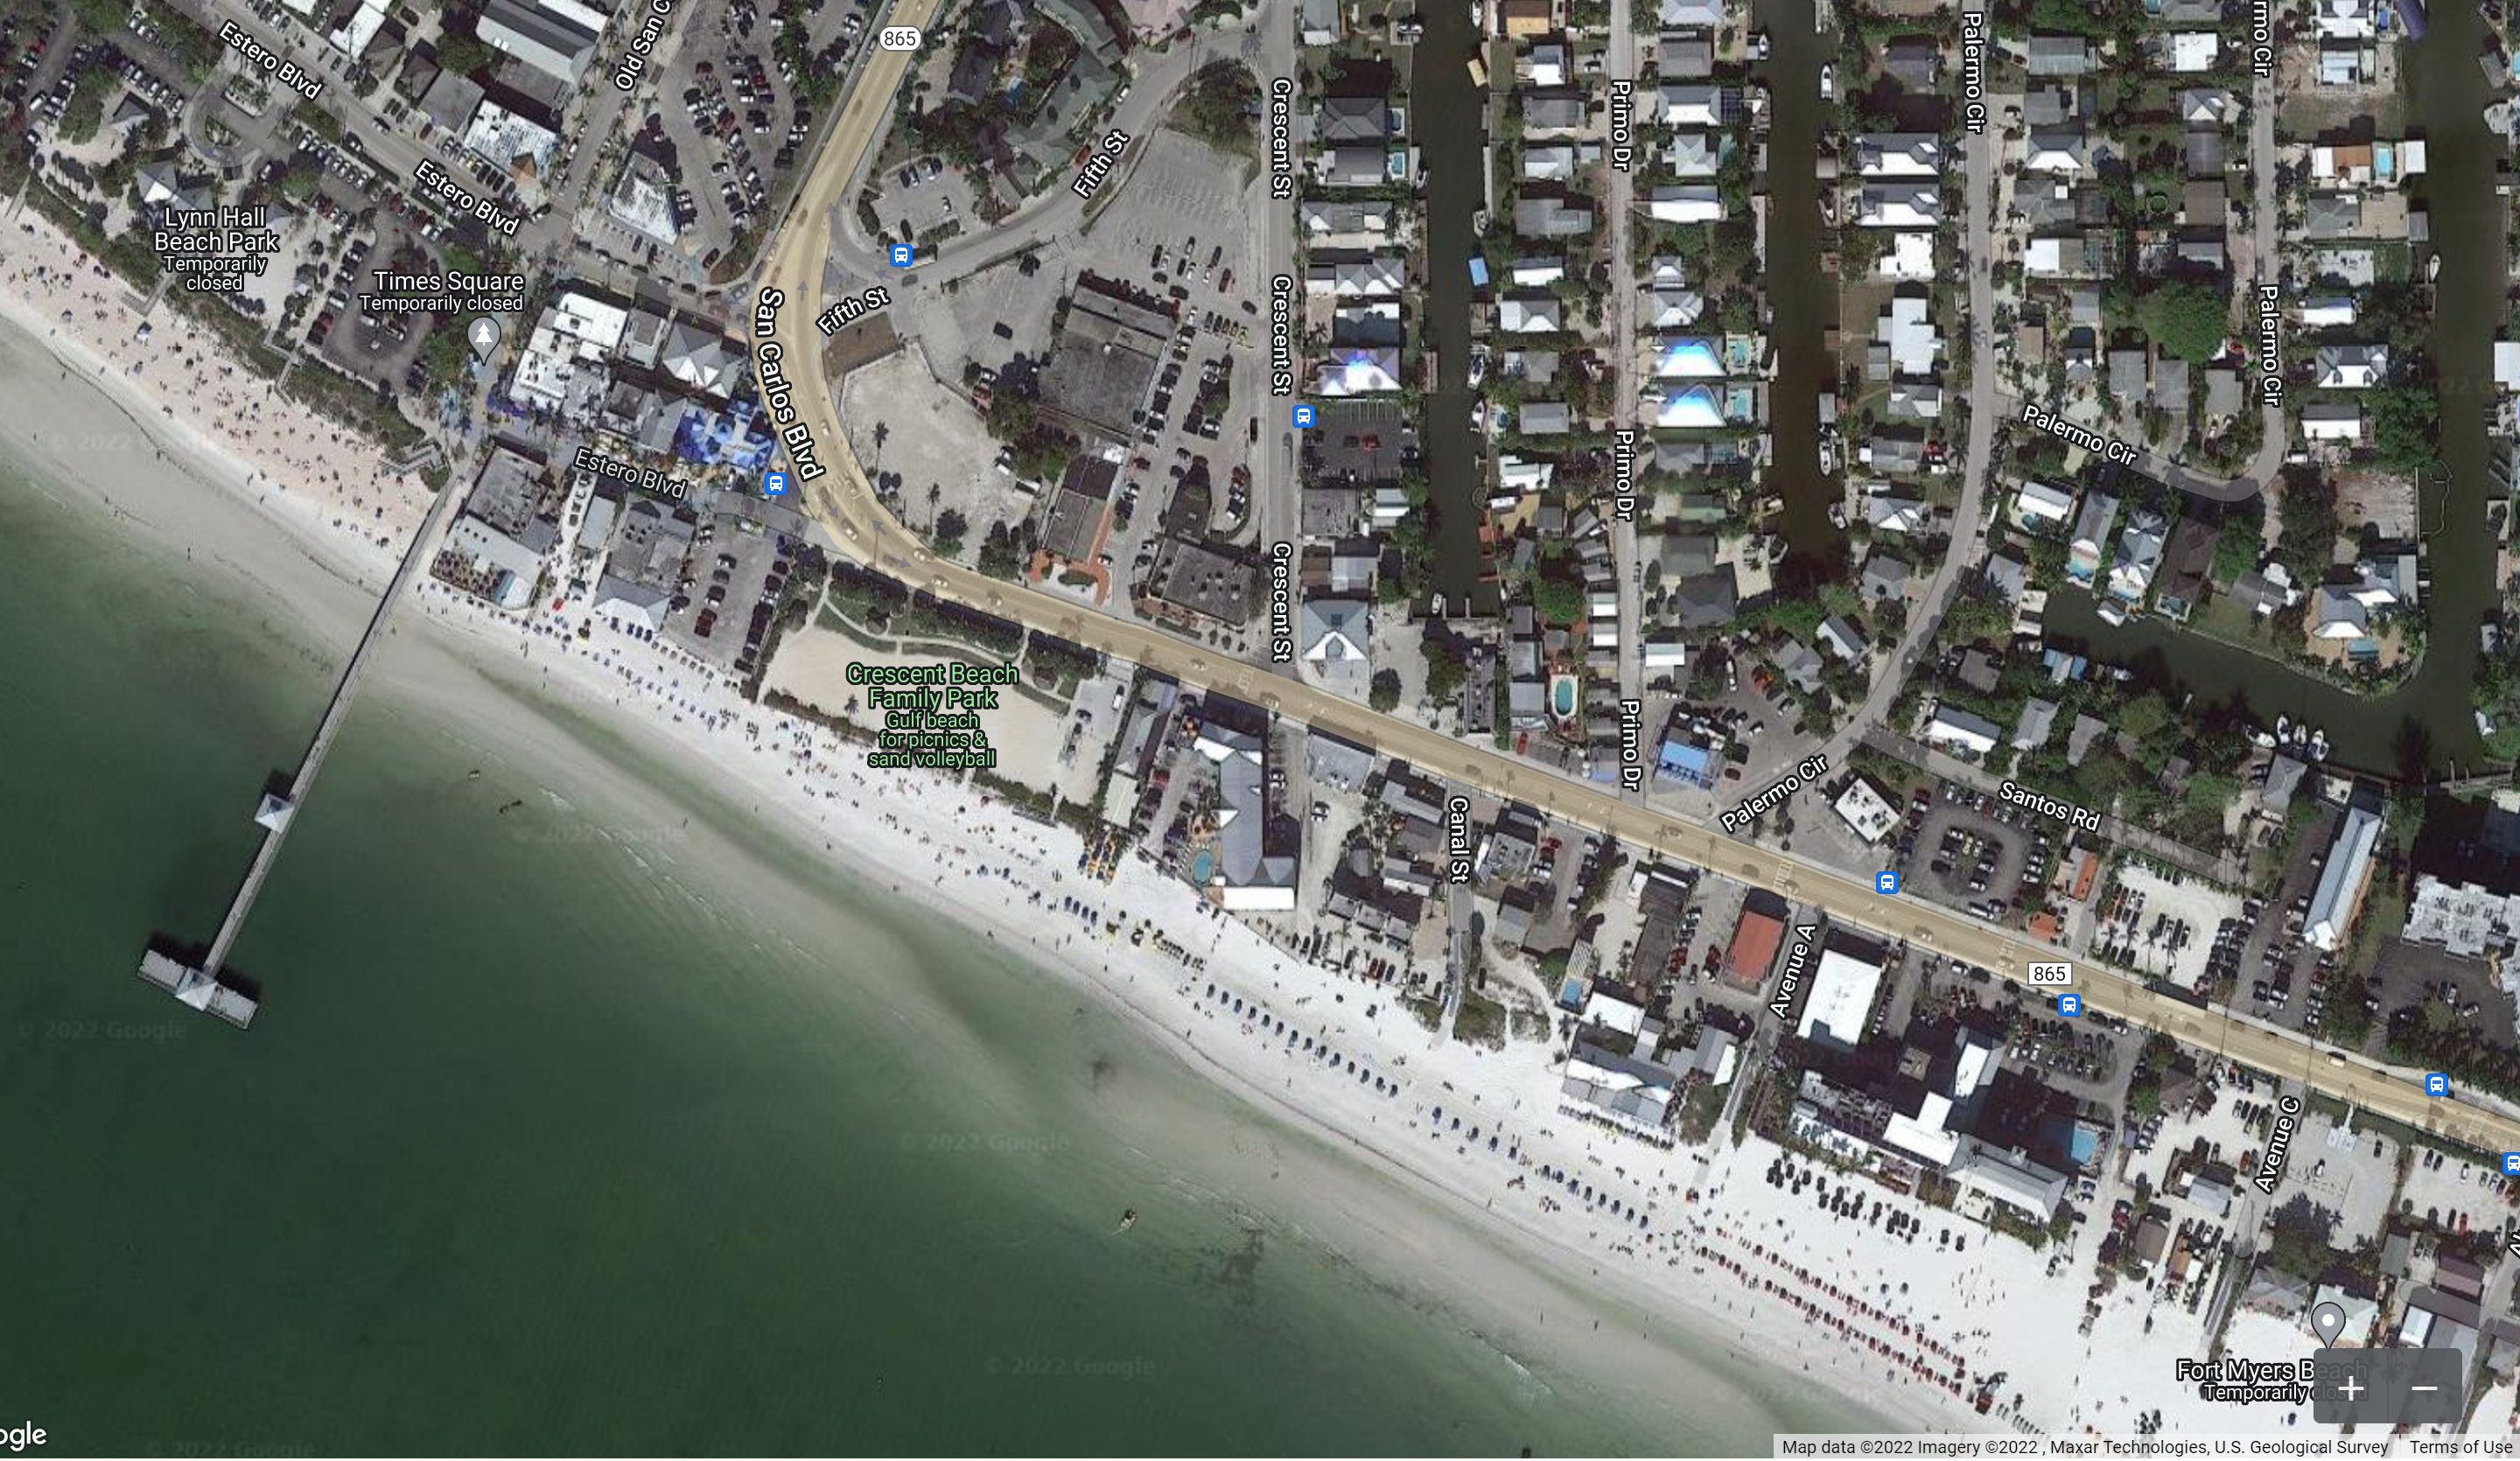
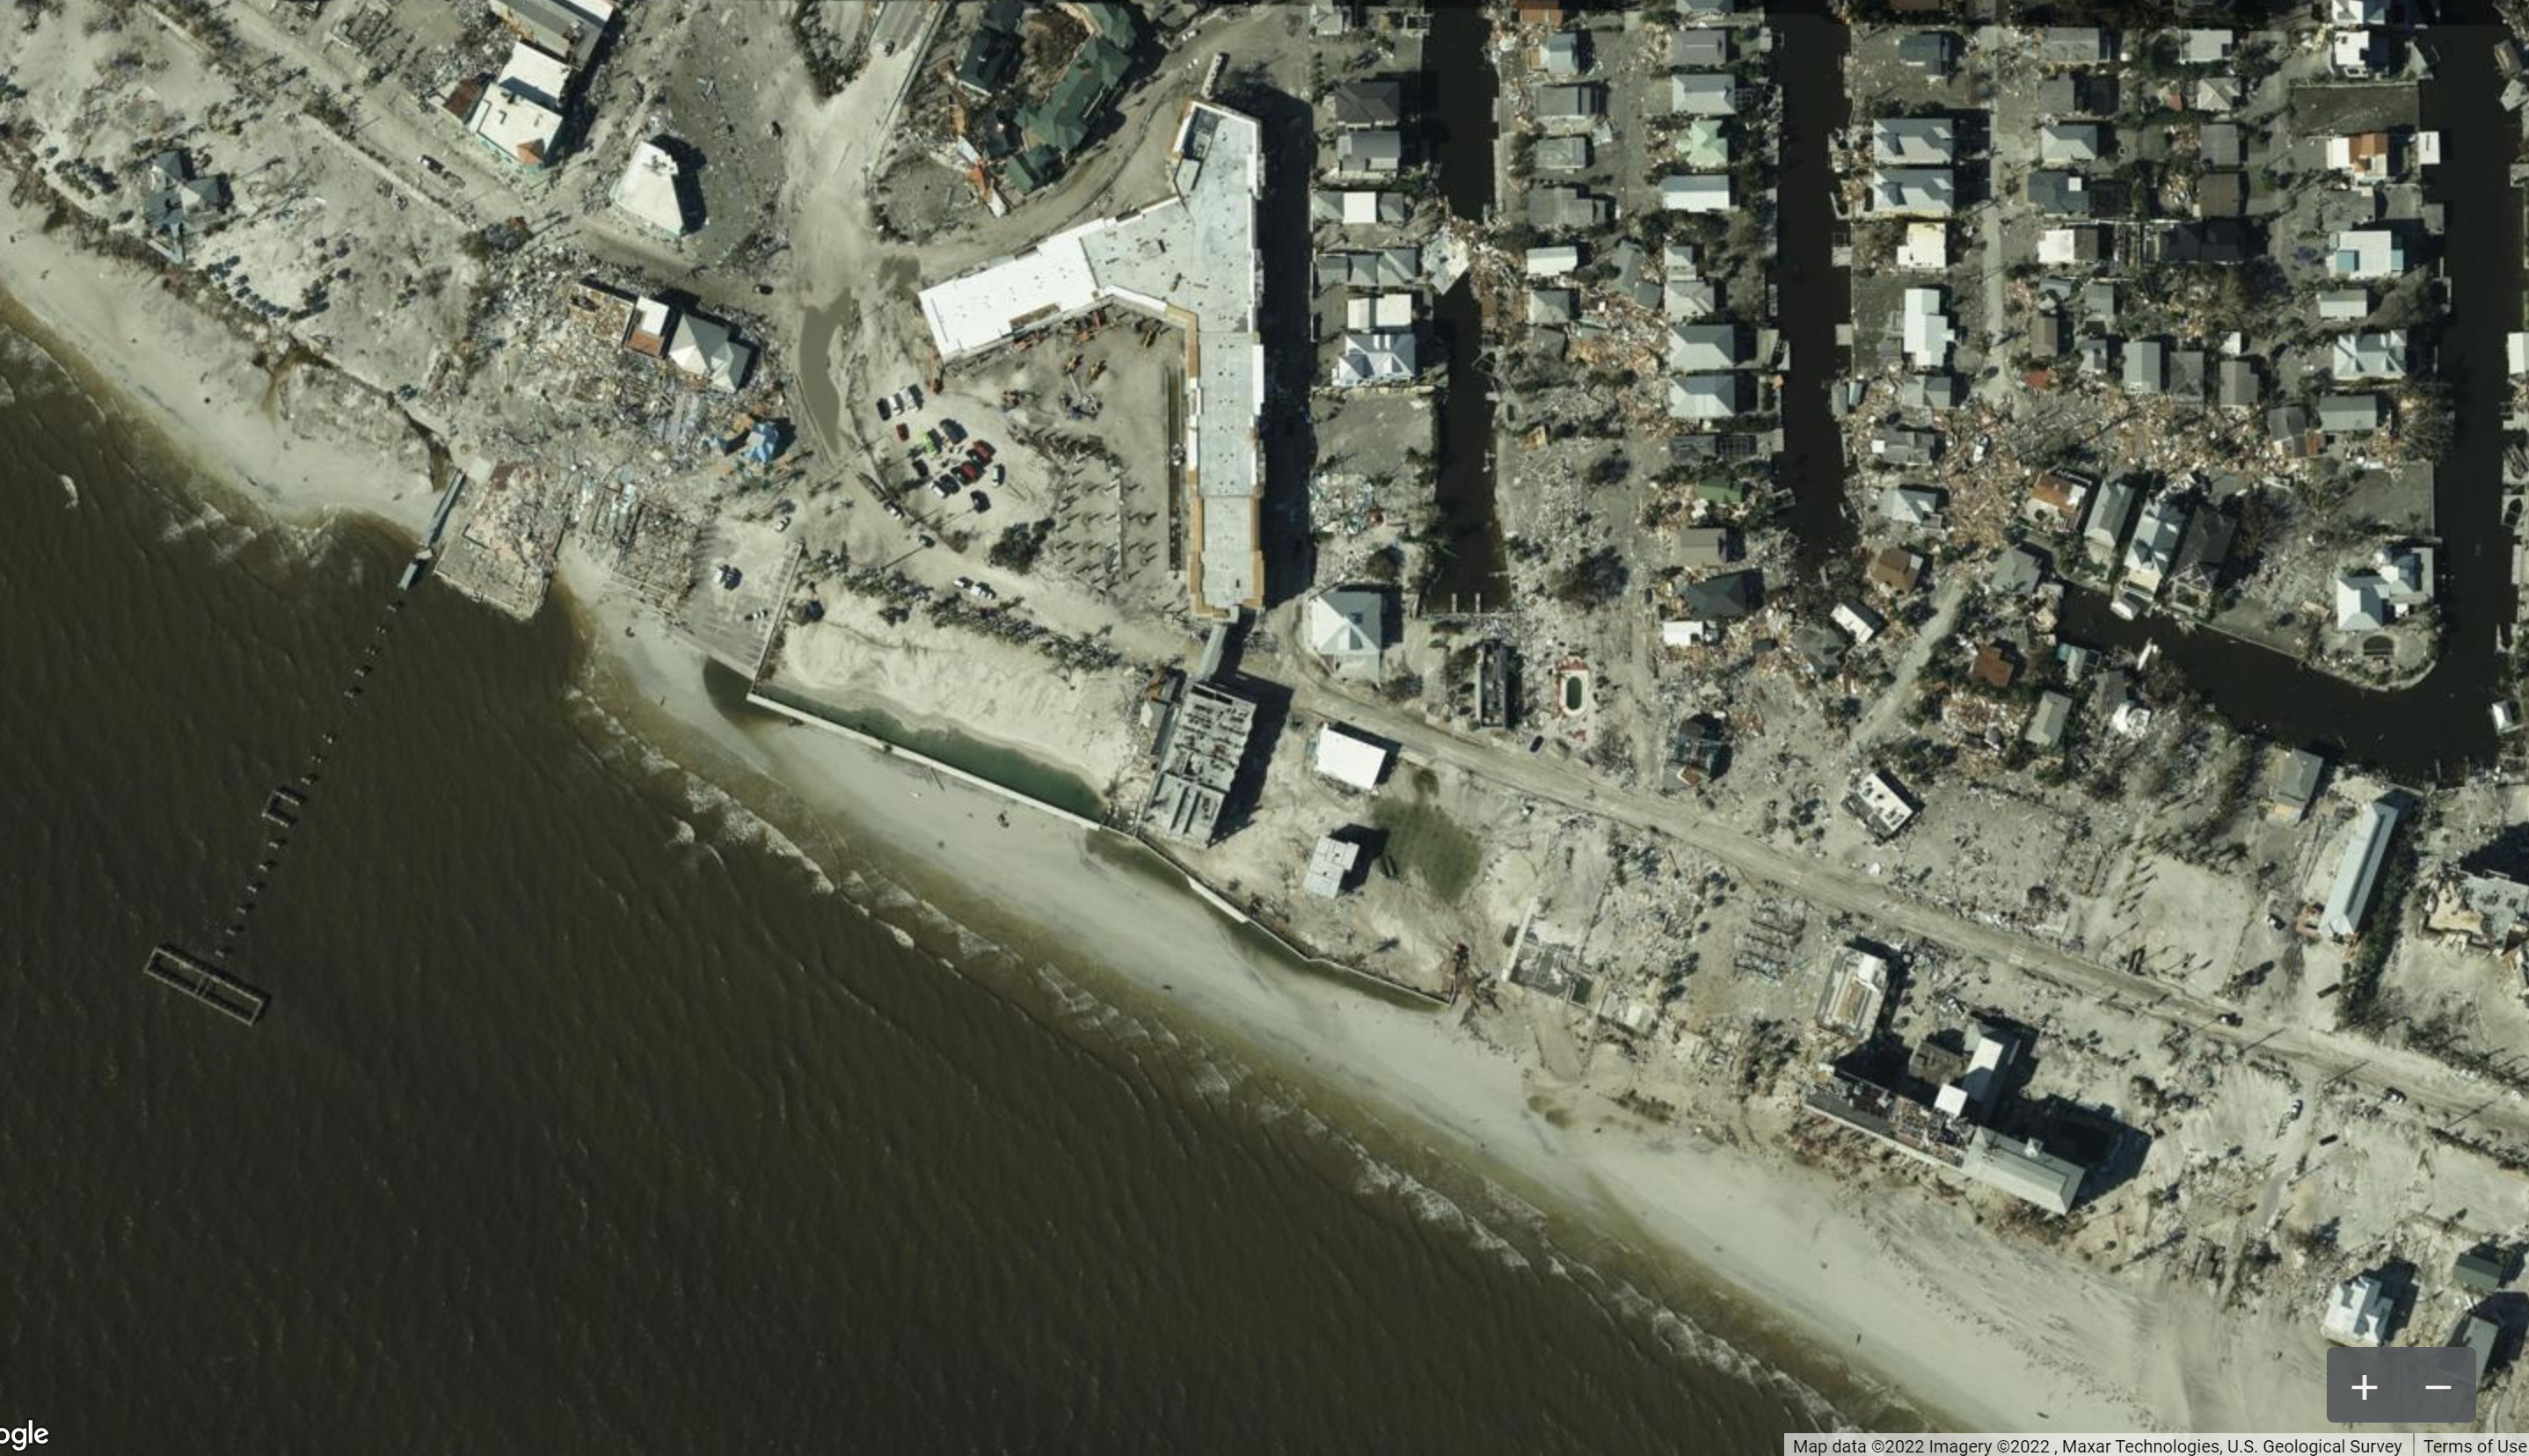
Vexcel Blue Sky Imagery (before Ian) and Gray Sky Imagery (after Ian) for part of Fort Myers Beach, FL
Machine learning (ML) is applied to Vexcel’s aerial imagery within hours of being published. The output is a full damage assessment on properties impacted by Hurricane Ian by comparing recent aerial images with current disaster imagery. The data includes an overall Post Catastrophic score, approximate FEMA classification, and other roof damage attributes. These property-level details will cover every property that falls within the Vexcel’s post-CAT collection area, and typically become available 1-2 days after the event as conditions allow.
Using this imagery and data analytics, end users can:
- Better manage and scale responses to heavily impacted customers
- Proactively identify policy holders with damaged property and begin the claims process immediately
- Deploy resources, i.e., field adjusters, more effectively and safely with detailed information for remote assessment on damaged structures
- Pinpoint key learnings to shore up underwriting and risk policies for future events
Please contact your Verisk representative with any questions about this aerial imagery offering.
Verisk Respond Hurricane Data
Verisk’s Respond Hurricane solution uses a multi-input model to provide a comprehensive and accurate view of tropical cyclone winds. The solution couples a five-day forecast of wind with a post-event view to provide a full wind field understanding of the impacts that have already occurred alongside the potential impacts that have yet to occur from a tropical system. The Respond Hurricane solution updates every six hours for any named storm in the Atlantic Ocean basin. Wind information is expressed both in terms of one-minute sustained wind speeds as well as three-second wind gusts. In addition, wind speed durations of 39 mph or greater (tropical storm force), 50 mph or greater, and 74 mph or greater (hurricane force) are also conveyed to provide a more comprehensive understanding of the wind threat.
In the event of a landfalling U.S. hurricane, within 24 hours of downgrade of the system to a tropical depression or post-tropical system, the Verisk Respond Hurricane maximum wind gust data are corrected by assimilating actual wind observations from multiple sources into the wind field to bias and error correct the modeled estimate. Special consideration is taken in this process to ensure the wind observations being incorporated accurately reflect the conditions at the location at a 10-meter height. This final maximum wind gust field will not only more closely match the assimilated observations, but final wind field values will be more accurate in general across the entire wind field, although typical differences between the modeled estimates and the observation-corrected post-storm are 10% or less. Respond Hurricane subscribers received this final view of Hurricane Ian’s wind footprint on Saturday evening, October 1st.
Please contact your Verisk representative with any questions regarding Respond Hurricane.
Additional Plans for Hurricane Ian
The Verisk ALERT Team continues to study the impacts of this historic storm. We will send a team of wind engineers to Florida to perform a damage survey this week and will provide updates as warranted in the coming days as to any additional plans regarding Hurricane Ian.
Post-Landfall Florida Wind and Surge | Downloads
Posting Date: October 3, 2022, 6:00:00 AM
The information provided herein is strictly confidential and is solely for the use of AIR clients; disclosure to others is prohibited.
Custom Simulated Event Sets
Note: These event sets contain five custom modeled scenarios for Hurricane Ian's wind and storm surge impacts in Florida.
| Product | Version | Description | Download |
|---|---|---|---|
| TOUCHSTONE | 9/10 | Selected set of simulated scenarios | |
| TOUCHSTONE Re | 9/10 | Selected set of simulated scenarios |
Industry Loss Based Similar Stochastic Event IDs
Note: These Event IDs are selected from the Verisk Hurricane Model for the U.S. based on the five modeled scenarios' industry loss footprints for Hurricane Ian
Additional Downloads
Note: Additional downloads related to the posting are listed below. Please use the appropriate application to view these files.