Hurricane Ian
Status: Closed
South Carolina SSEs | Summary
Posting Date: September 30, 2022, 10:00:00 AM
As of 8:00 am Friday, September 30, Hurricane Ian was located 105 miles south-southeast of Charleston, SC, with maximum 1-minute sustained winds of 85 mph and a minimum central pressure of 984 mb. It is forecast to make landfall sometime today just north of Charleston, SC.
ALERT™ subscribers can download similar stochastic event (SSE) IDs for Hurricane Ian’s anticipated landfall in South Carolina from the Downloads tab of this posting on the ALERT website. Compatible with Touchstone® and Touchstone Re™, the SSEs were selected based on Ian’s key meteorological parameters and its current forecast. They do not represent the impacts from Ian’s previous landfall in southwest Florida, and are recommended to be used with exposures in South Carolina, North Carolina, and Georgia.
ALERT™ subscribers can also download a Verisk Respond shapefile of modeled 3-second wind gusts across Ian’s path through Florida and forecast for South Carolina landfall from the Downloads tab of this posting on the ALERT website. Instructions are included for using this shapefile in Touchstone®. For more information on the Verisk Respond data, please see the ‘Verisk Respond Wind Shapefile’ section of this summary below.
Storm Surge Warnings are in place from the Flagler/Volusia County line in Florida to Cape Fear, NC, as well as the Neuse and St. John rivers. A Hurricane Warning is in place from the Savannah River in South Carolina to Cape Fear. Tropical Storm Warnings are set for Sebastian Inlet to Savannah River, and from Cape Fear to Duck, North Carolina, as well as for Pamlico Sound.
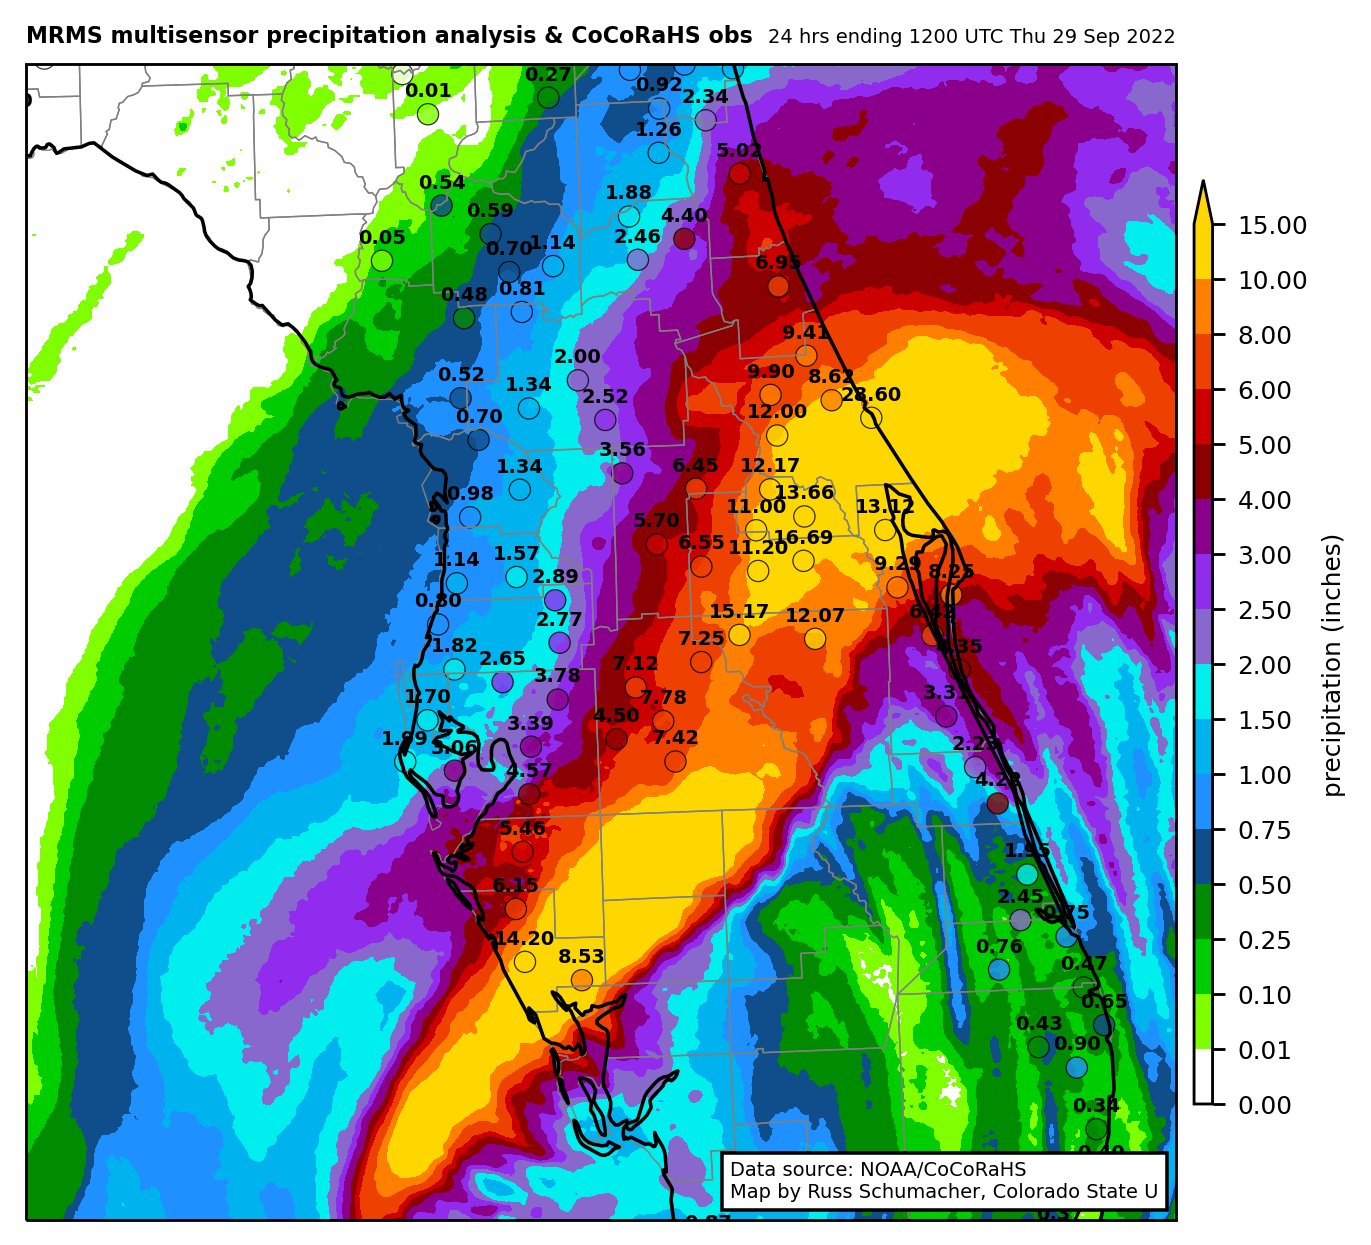
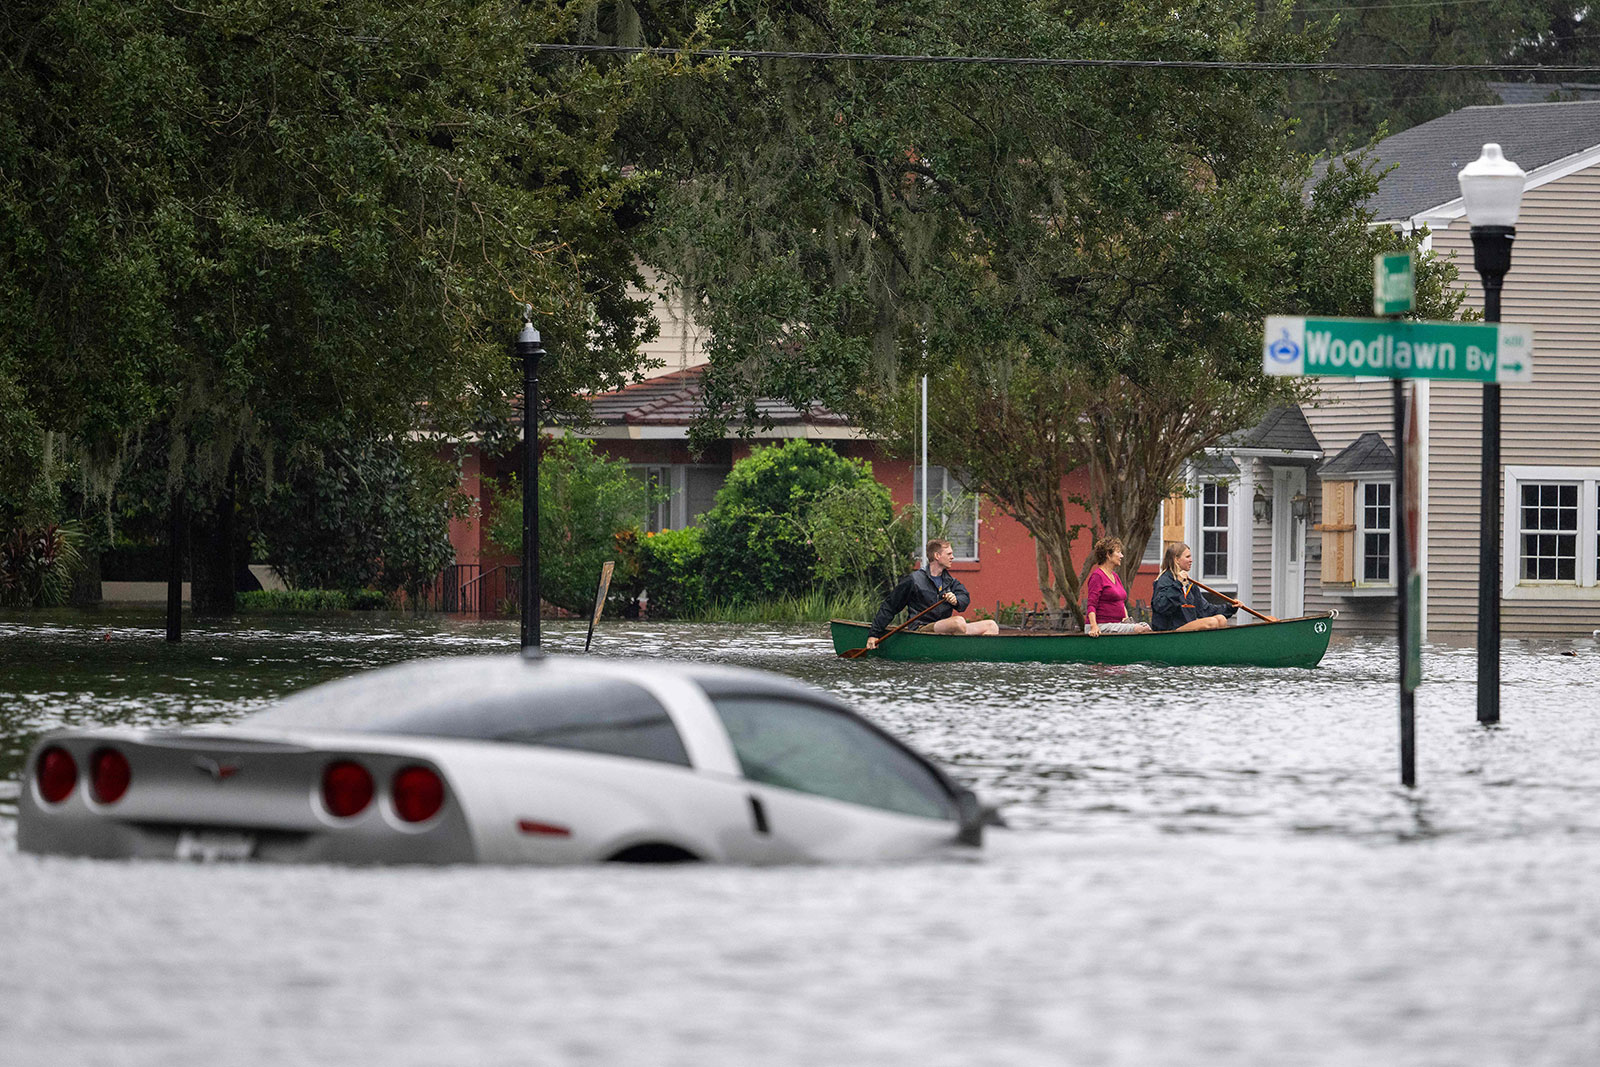
Hurricane Ian completed its trek across Florida on Thursday, emerging over the Atlantic Ocean near Cape Canaveral late Thursday morning as a strong Tropical Storm. As Ian moved inland, its primary impact appears to have been precipitation-induced flooding. A wide swath of 10+ inches of rain has been observed across Ian’s path through Florida, with a measurement of an incredible 28.6 inches at New Smyrna Beach on Florida’s east coast over a 27 hour period. Thirteen river gauges were at major flood stage as of Thursday afternoon, and four rivers – Peace, Horse Creek, Manatee, and Little Manatee – are all flooding based on gauge data as of Thursday evening. Widespread flooding was reported in Kissimmee as well, with images on social media showing a wide area of the downtown covered by sitting water. Airboats were required for rescue operations there during the day Thursday.


In St. Augustine, storm surge pushed over the seawall and by the afternoon on Thursday, had completely submerged State Road A1A near the Bridge of Lions and pushed inland toward North Ponce De Leon Boulevard. An estimated 6 foot storm surge was expected across much of the coastal areas of St. John’s county, where St. Augustine is located.
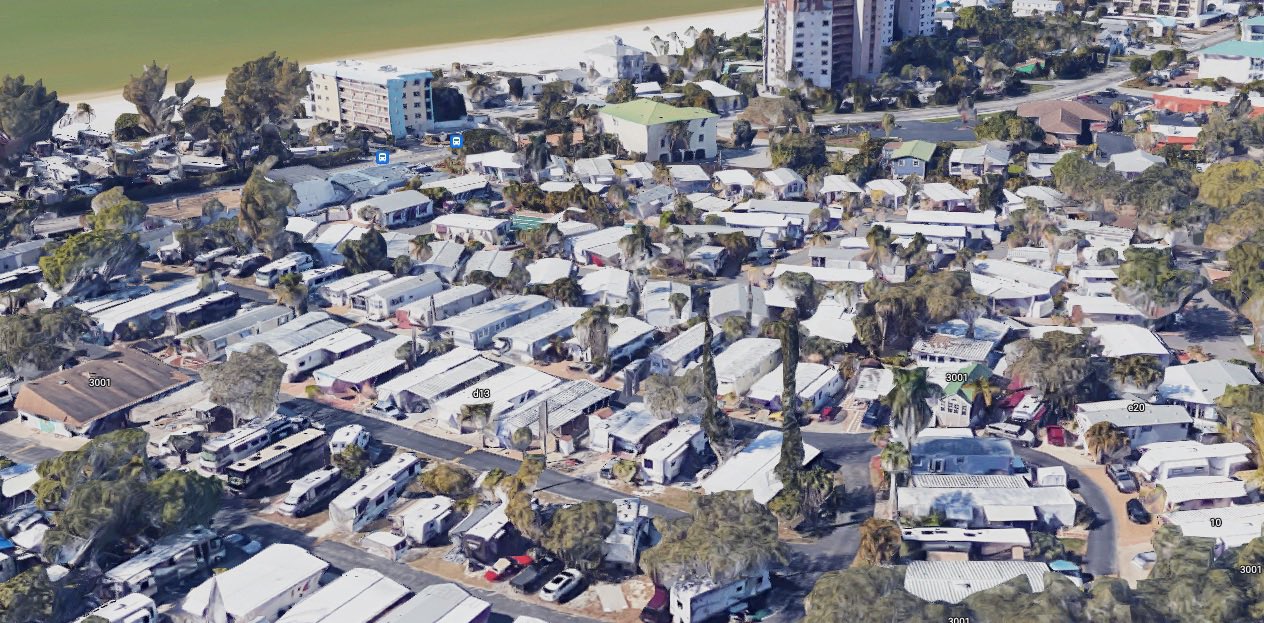
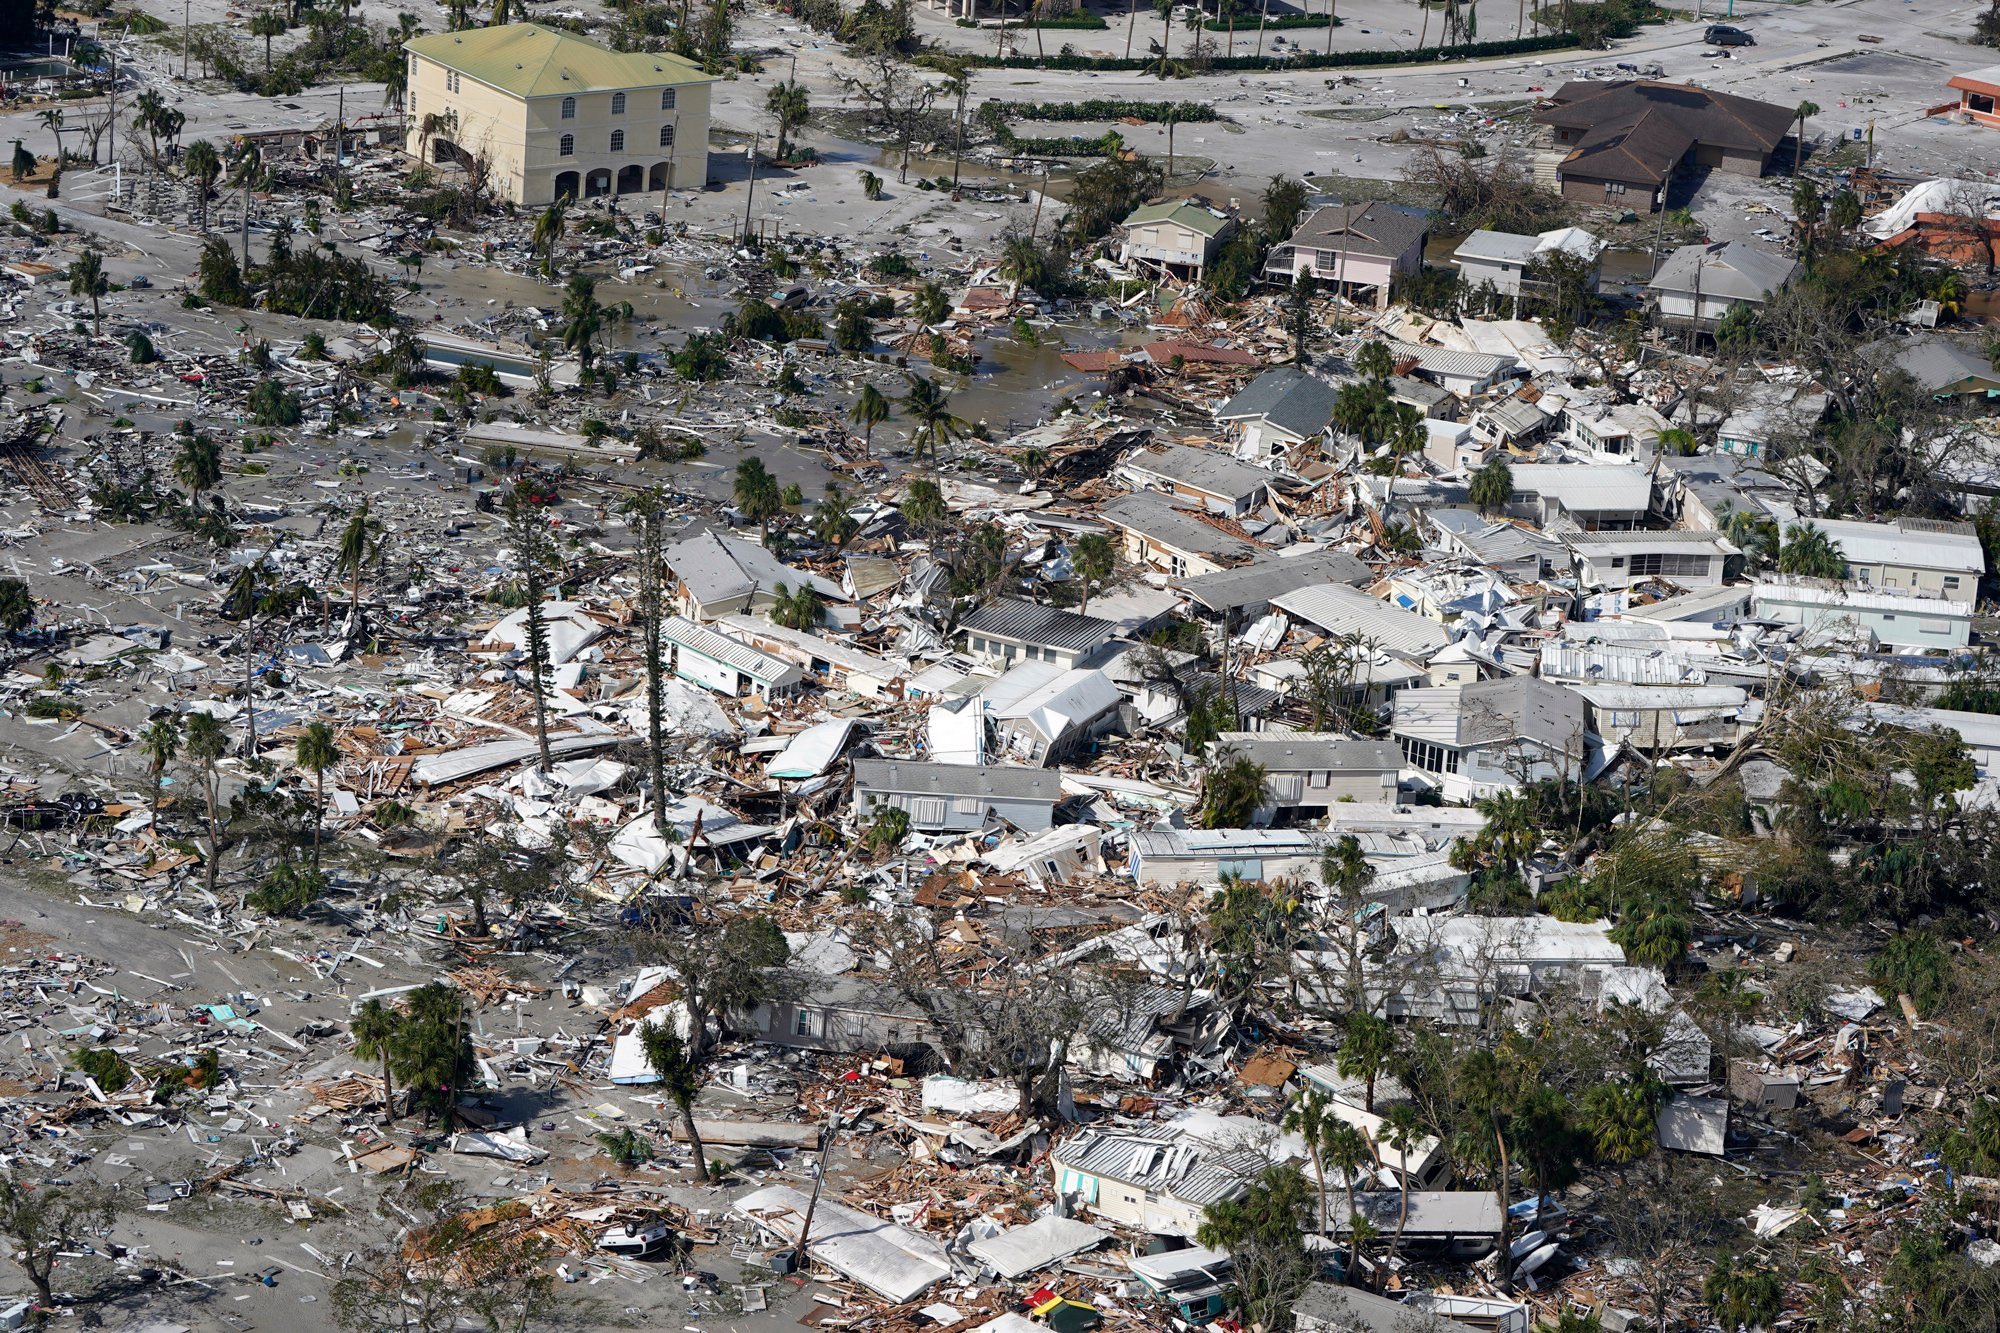
A picture of the destruction wrought by Ian in southwest Florida has started to emerge as well. Images of Fort Myers Beach showed catastrophic destruction, with the Times Square commercial district there largely unrecognizable from before Ian’s passing. Boats were pushed inland and left in the streets as the flood waters receded. The WINK TV studio in Fort Myers flooded from the surge, briefly interrupting their broadcast. Reports remain limited for Sanibel and Captiva islands, but similar damage is likely in those areas due primarily to Ian’s storm surge. According to Lee County's Department of Public Safety, the two barrier islands were “largely decimated”. A section of the Sanibel causeway heading out to the island was destroyed by the surge, and the road leading to the causeway was also heavily damaged. Drone footage of Sanibel Island showed houses submerged and many mobile homes moved from their location.


In Cape Coral, footage showed power lines down, trees uprooted, and massive damage to structures, including areas where only pilings remain from where houses once stood. In Fort Myers, the Caloosahatchee River flooded, impacting hotels and restaurants in the Main Street and Broadway area, near the Old Lee County courthouse. Images on social media showed significant surge related flooding in St. James, along with damage to roof coverings. Along the water, images showed many businesses completely wiped from their previous locations, and piles of boats scattered across the water’s edge. Fort Myers historic and downtown areas have also both suffered extensive damage.
Verisk Respond Wind Shapefile
Verisk’s Respond Hurricane solution uses a multi-input model to provide a comprehensive and accurate view of tropical cyclone winds. The solution couples a five-day forecast of wind with a post-event view to provide a full wind field understanding of the impacts that have already occurred alongside the potential impacts that have yet to occur from a tropical system. The Respond Hurricane solution updates every six hours for any named storm in the Atlantic Ocean basin. Wind information is expressed both in terms of one-minute sustained wind speeds as well as three-second wind gusts. In addition, wind speed durations of 39 mph or greater (tropical storm force), 50 mph or greater, and 74 mph or greater (hurricane force) are also conveyed to provide a more comprehensive understanding of the wind threat.
Verisk’s Respond Hurricane model adds improvements to a leading National Oceanic and Atmospheric Administration (NOAA) hurricane model. For each forecast time step of the model, the Verisk model performs computations to translate winds from above the surface of the Earth into 10-meter wind speeds and gusts. Further, the model uses information derived from satellites to compute surface friction and uses this to better understand the local impacts of how wind flows along the surface of Earth. Verisk’s model then temporally interpolates the data to present a more comprehensive depiction of the winds throughout the life of the system, including wind impacts between model time steps. For the post-event portion of the wind swath, short-term forecasts from prior model runs are aggregated in a similar manner as the forecast data to develop a best estimate modeled view of the full wind field throughout the life of the system.
In the event of a landfalling US hurricane, within 24 hours of downgrade of the system to a tropical depression or post-tropical system, the Verisk Respond Hurricane maximum wind gust data are corrected by assimilating actual wind observations from multiple sources into the wind field to bias and error correct the modeled estimate. Special consideration is taken in this process to ensure the wind observations being incorporated accurately reflect the conditions at the location at a 10-meter height. This final maximum wind gust field will not only more closely match the assimilated observations, but final wind field values will be more accurate in general across the entire wind field, although typical differences between the modeled estimates and the observation-corrected post-storm are 10% or less. Respond Hurricane solution subscribers will receive this final view of Ian’s winds in 1-2 days.
For this ALERT posting, we have provided the most recent Respond Hurricane maximum wind gust data, depicting the model estimate across Florida and forecast estimates across the Carolinas where maximum wind gusts are yet to occur but expected later today and tonight. The wind gust data are contoured at 30 mph increments whereas the full Respond Hurricane solution is contoured at 10 mph increments.
Users should note that the Respond Hurricane data is not necessarily reflective of modeling or losses produced by the Verisk Hurricane Model for the United States. The methods of producing the modeled winds are different between the two products, and in this case offer different perspectives of the wind as well – the Respond Hurricane shapefile is in 3-second gusts, while the Verisk Hurricane Model for the United States uses 1-minute sustained winds.
Plans for Hurricane Ian
The Verisk ALERT team plans to provide an insured industry loss estimate, custom event sets for Touchstone and Touchstone Re, industry loss based similar stochastic events, and custom event footprint shapefiles for Ian’s wind and storm surge impacts in Florida on Monday morning, October 3rd, London/BST.
We will continue to monitor and study the impacts from precipitation-induced flooding from Ian, as well as well as from the anticipated landfall in South Carolina, and provide an update on additional ALERT plans next week.
If you have questions about our response to Hurricane Ian or the Verisk Respond shapefiles, please contact your Verisk representative.
South Carolina SSEs | Downloads
Posting Date: September 30, 2022, 10:00:00 AM
The information provided herein is strictly confidential and is solely for the use of AIR clients; disclosure to others is prohibited.
Similar Stochastic Event IDs
Note: Today's similar stochastic events are for anticipated landfall in South Carolina only, and do not include impacts from Ian's previous landfall in southwest Florida.